




- 手机:13761418683
联系人:爱必信
网址:http://www.absin.cn/
地 址:上海市浦东新区新浩路58号18号楼

- 合成系列胆固醇衍生物,偶联不同胺类头基;
- 与 FDA 批准的PEG b PLGA组装成纳米载体库;
- 体外筛选:Aze Chol NP显著激活树突状细胞(DC),促共刺激分子(CD80/CD86/CD40/MHCII)高表达,大量分泌 TNF α、IL 1β、IL 6、IL 12p70(原文Fig.1)。
- 转录组 + 抑制剂 + 基因敲除验证:Aze Chol NP 专一激活 TLR9,不影响 TLR1/2/3/4/7/8;
- 分子对接:Aze Chol 与 TLR9 强结合(ΔG=?6.39 kcal/mol);
- 下游激活NF κB 与 MAPK信号,驱动 DC 成熟(原文Fig.2)。
- 皮下注射后靶向引流淋巴结,驻留超 5 天;
- 显著提升 DC 对抗原摄取,促进CD8α+、CD103+ cDC1交叉呈递,强力启动 CD8+ T 细胞(原文Fig.3、4)。
- 载 OVA 蛋白:Aze Chol NP@OVA 抑瘤率90%,优于 CpG+OVA;
- 载 OVA 肽:Aze Chol NP OVAp 诱导多功能效应 CD8+ T 细胞;
- 载 HPV E7 肽:联合抗 PD L1,80% 小鼠肿瘤完全消退,100 天长期存活,抵抗肿瘤再攻击(原文Fig.5、6)。
顶刊 Science Advances 重磅!TLR9 激动型纳米疫苗攻克肿瘤免疫
2026-07-08
近期,华南理工大学团队在Science Advances(IF≈20.2)发表突破性研究,开发TLR9 激活型胆固醇氮杂环丁烷衍生物纳米载体(Aze Chol NP),构建自佐剂化肿瘤治疗性疫苗,在黑色素瘤、HPV 相关肿瘤模型实现强效抑瘤,联合 PD L1 单抗治愈率达80%,为个性化肿瘤疫苗提供全新平台。
作为生命科学试剂优质服务商,Absin(爱必信) 核心产品abs90142 小鼠淋巴细胞分离液全程支撑关键免疫细胞实验,为高分成果保驾护航!
文献标题:TLR9-activating cholesterol azetidine derivative–assisted therapeutic vaccines for cancer immunotherapy
发表期刊:Sci Adv. (IF=12.5)
DOI:https://doi.org/10.1126/sciadv.aeb2465
使用 Absin 产品:小鼠脾脏淋巴细胞分离液试剂盒(货号:abs90142)

一、研究核心痛点:肿瘤疫苗的 "先天 + 抗原" 协同难题
肿瘤治疗性疫苗需同时实现先天免疫激活与高效抗原递呈,但传统疫苗存在两大瓶颈:
1. 佐剂与抗原理化性质差异大,共递送与胞内定位难;
2. 多数载体无固有佐剂活性,依赖外源佐剂,效果受限。
研究团队另辟蹊径:将胆固醇改造为兼具 TLR9 激动活性的疫苗载体,一材两用,同步完成免疫激活与抗原递送,破解协同难题。
二、研究思路:从分子设计到抗肿瘤全链条
1. 分子设计:筛选胆固醇衍生物,锁定 Aze Chol
Fig. 1. Immune-stimulating activity of Aze-Chol NP on DCs.
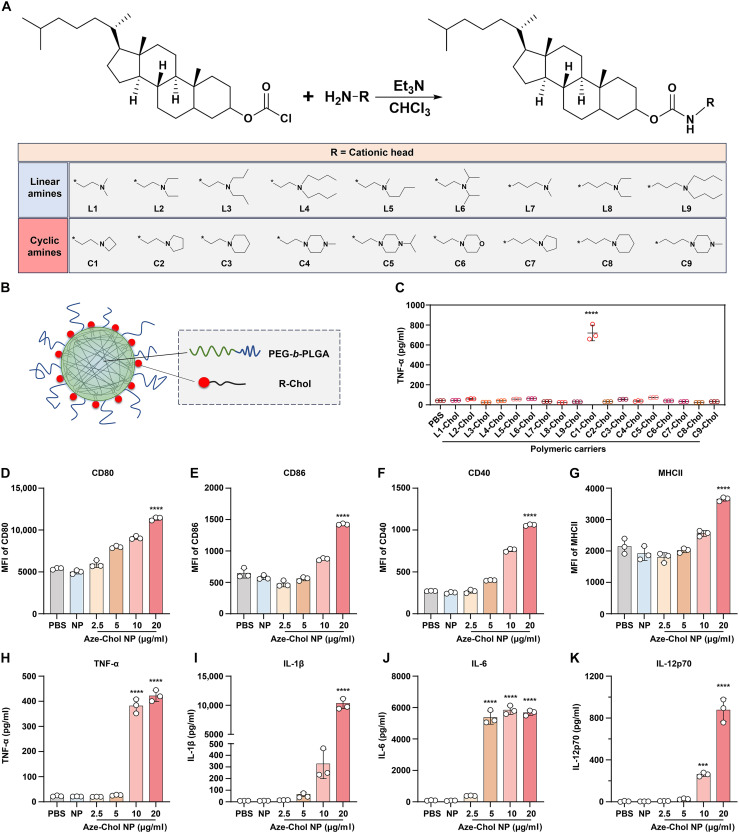
(A) Synthetic route and molecular structures of cholesterol derivatives composed of a cholesterol tail and either a linear or cyclic amine head group. (B) Schematic of the library of polymeric carriers formed by cholesterol derivatives and PEG-b-PLGA. (C) Quantification of TNF-α secretion by DC2.4 cells using enzyme-linked immunosorbent assay (ELISA). (D to G) Flow cytometry analysis of costimulatory molecules: (D) CD80, (E) CD86, (F) CD40, and (G) MHCII expression on BMDCs after 24-hour treatment with varying concentrations of Aze-Chol NP. MFI, mean fluorescence intensity. (H to K) ELISA quantification of proinflammatory cytokines in BMDC culture supernatants after 24-hour treatment with Aze-Chol NP: (H) TNF-α, (I) IL-1β, (J) IL-6, and (K) IL-12p70. ***P < 0.001 and ****P < 0.0001.
2. 机制揭秘:精准靶向 TLR9 NF κB/MAPK 通路
Fig. 2. Mechanistic investigation of TLR9-mediated activation of DCs by Aze-Chol NP.
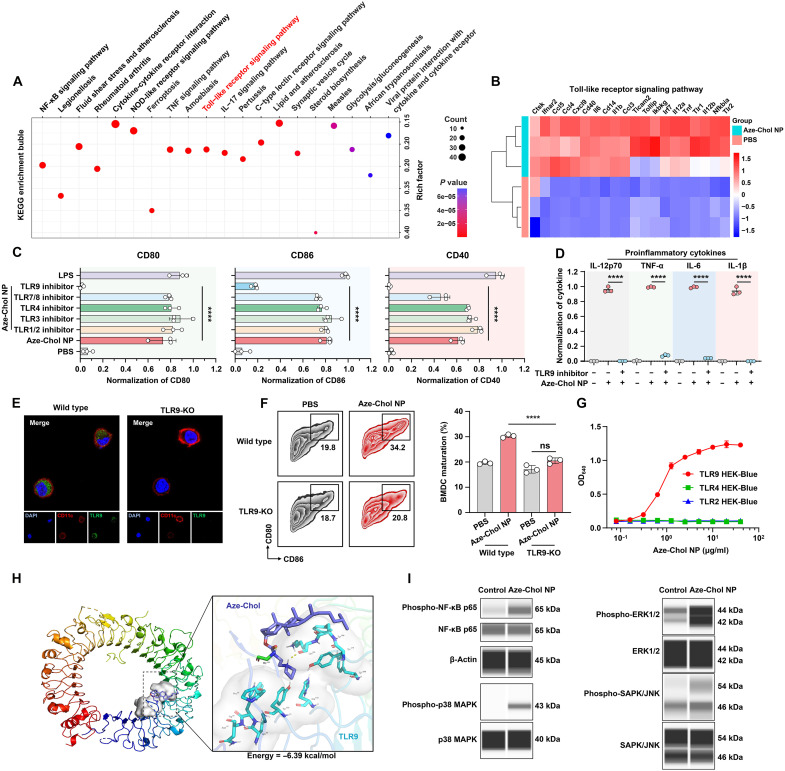
(A) KEGG pathway enrichment analysis of transcriptomic data from BMDCs treated with Aze-Chol NP (20 μg/ml) versus PBS. NOD, nucleotide-binding oligomerization domain. Dot size and color indicate gene count and significance, respectively. (B) Heatmap of TLR signaling–related gene expression in BMDCs treated with Aze-Chol NP versus PBS. Z-score normalized values are shown across biological replicates (n = 3 per group). (C) Effect of TLR inhibition on Aze-Chol NP–induced BMDC activation. Flow cytometry analysis of CD80, CD86, and CD40 expression after 1-hour pretreatment with inhibitors against TLR1/2 (CU CPT 22), TLR3 (CU CPT 4a), TLR4 (TAK-242), TLR7/8 (ODN 2088 control), or TLR9 (ODN 2088), followed by Aze-Chol NP stimulation for 24 hours. MFI was min-max normalized. (D) Levels of TNF-α, IL-1β, IL-6, and IL-12p70 in supernatants of BMDCs after 1-hour ODN 2088 pretreatment and 24-hour Aze-Chol NP stimulation (20 μg/ml). Data are presented as min-max–normalized values. (E) Immunofluorescence validating TLR9 knockout (TLR9-KO) in BMDCs from TLR9-KO versus WT mice. Representative images show TLR9 (green, Alexa Fluor 488), CD11c (red, phycoerythrin), and nuclei (DAPI). (F) Flow cytometry analysis of BMDC maturation in WT and TLR9?/? mice after 24-hour Aze-Chol NP treatment (20 μg/ml). Left: representative flow cytometry plots; right: percentage of mature (CD80+CD86+) BMDCs. (G) TLR9-dependent NF-κB activation by Aze-Chol NP assessed using a SEAP reporter assay in HEK-Blue hTLR2, hTLR4, and hTLR9 cells. Optical density at 640 nm (OD640) reflects SEAP activity. (H) Molecular docking analysis of the interaction between Aze-Chol and TLR9 protein. (I) Activation of MAPK and NF-κB signaling in Aze-Chol NP–treated BMDCs. Representative automated capillary Western blot showing phosphorylated and total levels of NF-κB p65, p38 MAPK, ERK1/2, and SAPK/JNK in BMDCs treated with Aze-Chol NP (20 μg/ml, 4 hours) versus PBS. ****P < 0.0001.
3. 体内递送:高效淋巴结富集,提升抗原交叉呈递
Fig. 3. In vivo biodistribution and innate immune activation induced by Aze-Chol NP.
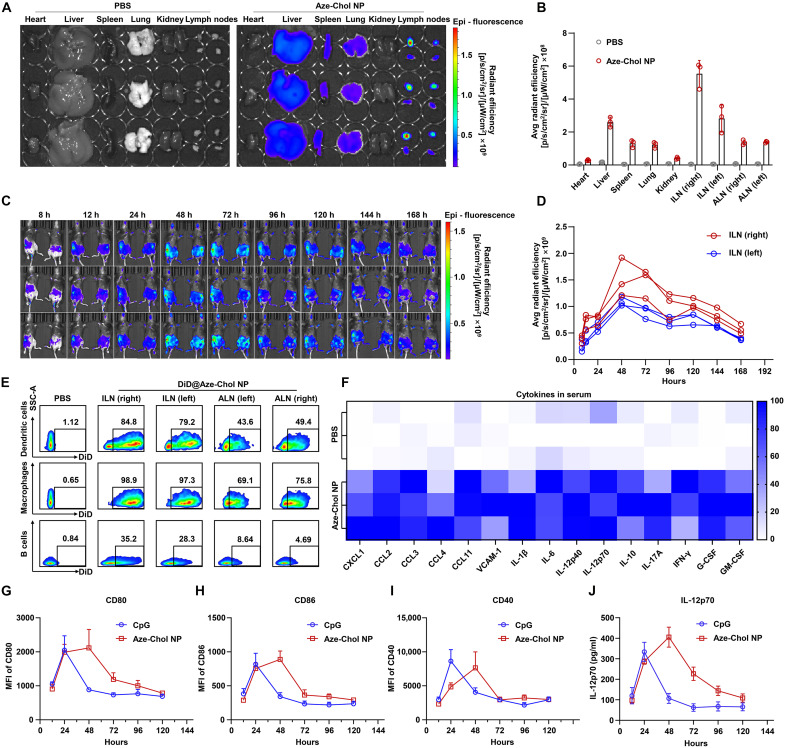
(A and B) Biodistribution of DiD-labeled Aze-Chol NP (20 mg/kg dose) in C57BL/6 mice following subcutaneous injection. (A) Ex vivo fluorescence imaging of major organs (heart, liver, spleen, lung, and kidney) and draining LNs (ILN and ALN) at 72 hours postinjection. (B) Semiquantitative analysis of normalized fluorescence intensity in regions of interest. Color scale represents radiant efficiency [(photons/s/cm2/sr)/(μW/cm2)]. (C and D) Enrichment and retention of DiD@Aze-Chol NP in ILNs over time. (C) In vivo imaging and (D) fluorescence quantification of ILNs at indicated time points postadministration. n = 3 biologically independent replicates. h, hours. (E) Flow cytometry analysis of Aze-Chol NP uptake by DCs in ILNs 72 hours after subcutaneous administration. Representative flow cytometry plots showing DiD+ cells among CD11c+MHCII+ DCs, CD11b+F4/80+ macrophages, and CD19+ B cells. (F) Serum cytokine profiling in C57BL/6 mice at 24 hours post-Aze-Chol NP injection (20 mg/kg). Heatmap showing normalized concentrations of 15 immunomodulatory cytokines measured by multiplex bead-based immunoassay (ABplex). VCAM-1, vascular cell adhesion molecule–1; G-CSF, granulocyte colony-stimulating factor; GM-CSF, granulocyte-macrophage colony-stimulating factor. (G to J) In vivo kinetics of innate immune activation in dLNs. MFI of (G) CD80, (H) CD86, and (I) CD40 on cDCs; and (J) IL-12p70 production in dLNs at indicated time points following subcutaneous administration of Aze-Chol NP (20 mg/kg) (red) or CpG ODN (blue).
Fig. 4. Preparation and immune activation of nanovaccine Aze-Chol NP@OVA.
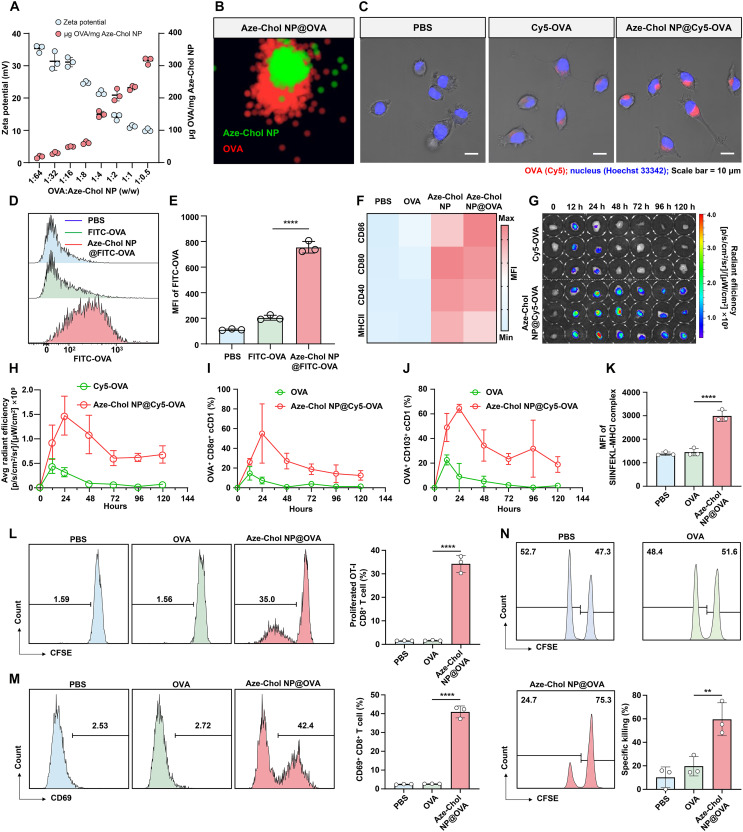
(A) Zeta potential and quantification of OVA protein adsorption on Aze-Chol NP@OVA nanovaccines. (B) STORM image of Aze-Chol NP@OVA. Green (rhodamine B), Aze-Chol NP; red (Cy5), OVA. (C) Representative confocal fluorescence images of DC2.4 cells incubated with Cy5-OVA or Aze-Chol NP@Cy5-OVA (Aze-Chol NP at 20 μg/ml). Red, Cy5-OVA; blue, nuclei. Scale bars, 10 μm. (D and E) Flow cytometry analysis of OVA uptake by BMDCs incubated with free OVA or Aze-Chol NP@OVA (Aze-Chol NP at 20 μg/ml) for 24 hours. (D) Representative histograms; (E) MFI quantification. FITC, fluorescein isothiocyanate. (F) Heatmap showing MFI of CD80, CD86, CD40, and MHCII expression on BMDCs after incubation with OVA, Aze-Chol NP, or Aze-Chol NP@OVA for 24 hours. (G and H) Biodistribution kinetics of Aze-Chol NP@Cy5-OVA (Aze-Chol NP at 20 mg/kg) in ILNs of C57BL/6 mice following subcutaneous administration. (G) Ex vivo fluorescence imaging and (H) semiquantitative analysis at indicated time points postinjection with free Cy5-OVA or Aze-Chol NP@Cy5-OVA. (I and J) Flow cytometry analysis of Cy5-OVA uptake by (I) resident CD8α+CD11c+MHCII+ cDC1s and (J) migratory CD103+CD11c+MHCII+ cDC1s in ILNs following subcutaneous injection with free Cy5-OVA or Aze-Chol NP@Cy5-OVA. (K) SIINFEKL-MHCI complex levels on BMDCs after incubation with OVA (10 μg/ml) or Aze-Chol NP@OVA (Aze-Chol NP at 20 μg/ml) for 24 hours. (L and M) OT-I CD8+ T cell proliferation and activation after 72-hour coculture with OVA- or Aze-Chol NP@OVA–treated BMDCs. Left shows representative flow cytometry plots; right shows quantification of (L) proliferation (by CFSE dilution) and (M) activation (by CD69 expression). (N) In vivo evaluation of OVA-specific CTL responses. Representative flow cytometry plots and quantification of OVA peptide–specific target cell lysis percentages are shown. **P < 0.01 and ****P < 0.0001.
4. 疫苗构建:蛋白 / 肽疫苗双适配,疗效碾压传统 CpG
Fig. 5. Antigen-specific immune response and therapeutic activity of Aze-Chol NP@OVA.
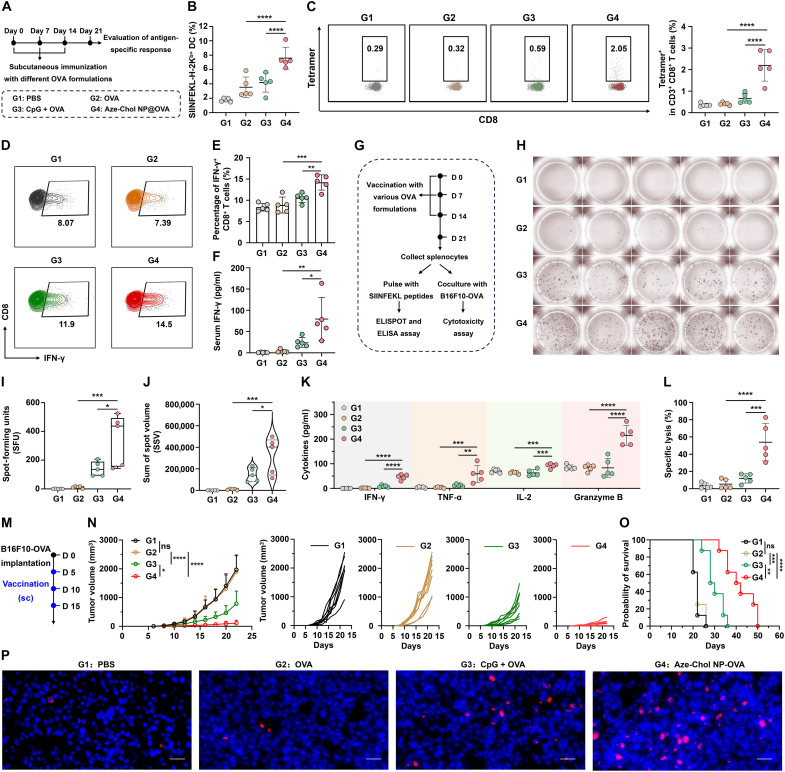
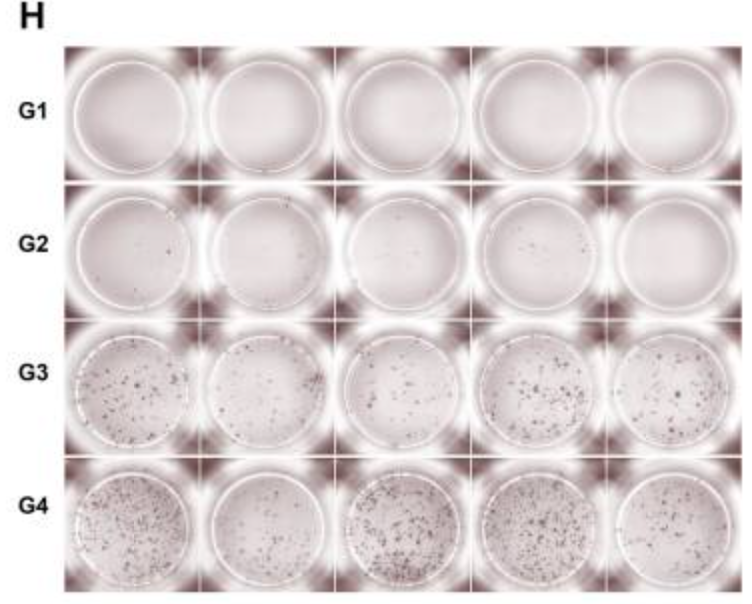
(A) Schematic showing the immunization schedule of C57BL/6 mice subcutaneously (sc) injected with PBS (G1; Group 1), OVA alone (G2; Group 2), CpG + OVA (G3; Group 3), or Aze-Chol NP@OVA nanovaccine (G4; Group 4; Aze-Chol NP at 20 mg/kg) once weekly for 3 weeks. (B) Flow cytometry quantification of cDCs presenting SIINFEKL peptide on H-2Kb in dLNs of immunized mice. (C) Representative dot plots (left) and quantification (right) of OVA-specific (SIINFEKL-MHCI tetramer-positive) CD8+ T cells in peripheral blood after immunization. (D and E) Representative dot plots (D) and quantification (E) of IFN-γ–positive CD8+ T cells in peripheral blood postimmunization. (F) Serum IFN-γ concentrations quantified by ELISA at day 21 postimmunization. (G) Experimental timeline for assessing antigen-specific immune responses after immunization with OVA, CpG + OVA, or Aze-Chol NP@OVA. (H) Representative ELISPOT images of IFN-γ–secreting splenocytes stimulated ex vivo with SIINFEKL peptide for 48 hours. (I and J) Quantification of (I) IFN-γ spot-forming units (SFU) and (J) sum of spot volume (SSV) from splenocytes stimulated as described in (G). (K) Levels of cytokines (IFN-γ, TNF-α, IL-2, and granzyme B) associated with T cell activation and effector function, measured by ELISA after ex vivo stimulation of splenocytes with SIINFEKL peptide for 72 hours. (L) Percentages of specific tumor cell lysis measured by Hoechst 33342 staining following 72-hour coculturing of splenocytes from immunized mice with OVA-expressing B16F10 cells. (M) Schemes showing the tumor challenge experiment design. D 0, D 5, D 10 and D15 indicate Day 0, Day 5, Day 10 and Day 15, respectively. (N) Average (left) and individual (right) tumor growth curves of C57BL/6 mice bearing B16F10-OVA tumors, treated as indicated. (O) Survival curves of tumor-bearing mice after treatment with PBS, OVA, CpG + OVA, or Aze-Chol NP@OVA. (P) Representative immunofluorescence staining showing CD8+ T cell infiltration (red) and nuclei (blue) in tumor sections from indicated treatment groups. Scale bars, 100 μm. *P < 0.05, **P < 0.01, ***P < 0.001, and ****P < 0.0001.
Fig. 6. Superior therapeutic activity of Aze-Chol NP–based peptide vaccine and its synergized anticancer activity with ICB therapy.
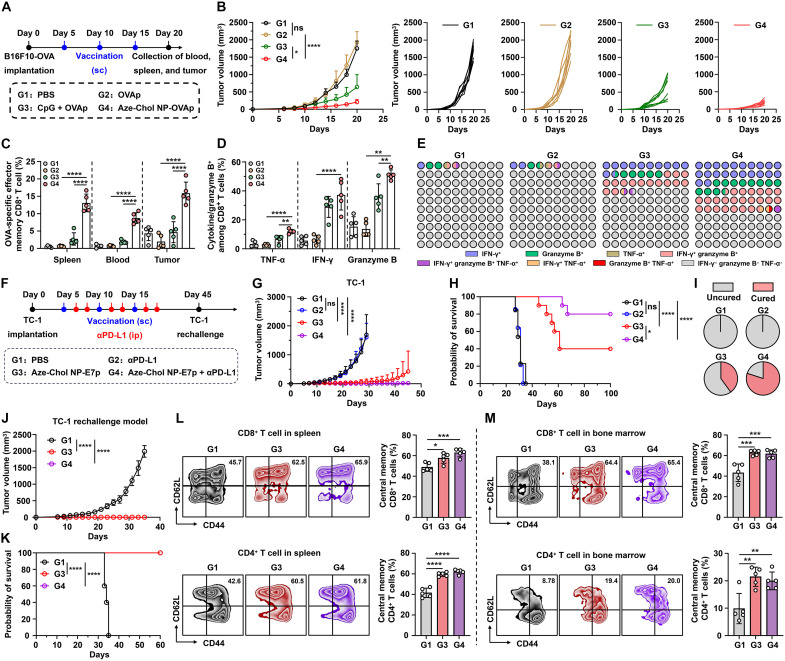
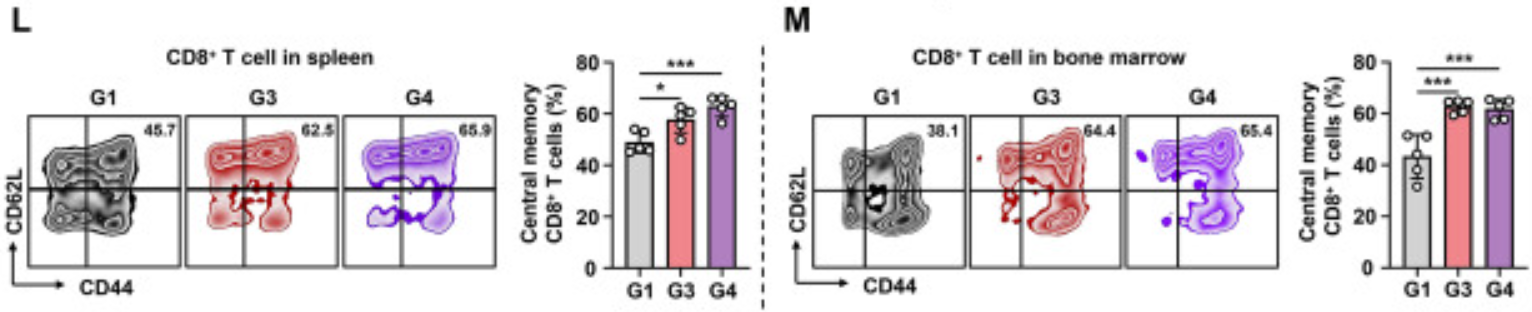
(A) Therapeutic regimen of Aze-Chol NP-OVAp vaccine in the B16F10-OVA melanoma model. (B) (Left) Average and (right) individual tumor growth curves of C57BL/6 mice treated with OVA peptide, CpG + OVA peptide, and Aze-Chol NP-OVAp (Aze-Chol NP at 20 mg/kg). (C) Frequency of OVA antigen–specific effector memory CD8+ T cells in various tissues, analyzed by flow cytometry. (D) Effector function of tumor-infiltrating CD8+ T cells. Percentages of TNF-α, IFN-γ, or granzyme B–secreted CD8+ T cells within tumor after OVA peptide restimulation are shown. (E) Proportion of multifunctional CD8+ T cells capable of simultaneously secreting one, two, and three effector cytokines (TNF-α, IFN-γ, and/or granzyme B) in tumor was displayed as a 10 by 10 dot plot. (F) Schematic of therapeutic regimen and tumor rechallenge study of Aze-Chol NP-E7p in combination with αPD-L1 antibody in TC-1 cervical cancer model. ip, intraperitoneal. (G) Average TC-1 tumor growth curves of C57BL/6 mice treated with αPD-L1 antibody, Aze-Chol NP-E7p, and Aze-Chol NP-E7p in combination with αPD-L1 antibody (Aze-Chol NP at 20 mg/kg). (H and I) (H) Survival curves of C57BL/6 mice following indicated treatments were obtained using the Kaplan-Meier method, (I) along with pie charts representing the percentage of cured mice quantified by tumor-free survival (>60 days). (J and K) Long-term immune effect induced by Aze-Chol NP-E7p against TC-1 rechallenge. (J) Average tumor growth curves and (K) survival curves of cured mice from indicated groups after TC-1 tumor rechallenge on day 45. Age-matched naive C57BL/6 mice served as controls. (L and M) Representative flow cytometry plots and frequencies of central memory (CD44+CD62L+) CD8+ T cells (top) and CD4+ T cells (down) in the (L) spleen and (M) bone marrow. *P < 0.05, **P < 0.01, ***P < 0.001, and ****P < 0.0001.
三、Absin abs90142:高分文章的 "免疫细胞分离利器"
本研究中,Absin abs90142 小鼠淋巴细胞分离液是免疫表型与功能实验的核心支撑,作用不可替代:
1. 高效分离脾脏 / 外周血淋巴细胞
研究需大量获取小鼠淋巴细胞用于ELISPOT、流式细胞术、细胞毒性实验,abs90142 基于密度梯度离心,快速分离高纯度、高活性淋巴细胞,保障后续抗原特异性 T 细胞检测准确可靠。
2. 适配多项关键实验
支撑IFN γ ELISPOT、抗原特异性 CTL 杀伤、记忆 T 细胞分析等核心实验,为 "疫苗诱导强效、持久抗肿瘤免疫" 提供直接数据(原文Fig.5H L、6L M)。

3. 产品核心优势
| 优势 | 说明 |
| 专为小鼠优化 | 分离纯度高、活率高 |
| 低内毒素、无菌 | 不干扰免疫细胞功能 |
| 操作简便 | 离心后清晰形成淋巴细胞层,重复性好 |
四、研究创新与临床价值
| 序号 | 创新点 | 价值 |
| 1 | 首创非核酸类小分子 TLR9 激动载体 | 突破传统 CpG ODN 局限,稳定性、递送性大幅提升 |
| 2 | 自佐剂一体化平台 | 载体 = 佐剂 + 递送系统,简化制备,适配蛋白 / 肽 / 新抗原疫苗 |
| 3 | 联合 ICB 疗效倍增 | 为临床 "疫苗 + 免疫检查点抑制剂" 联合方案提供新策略 |
| 4 | 临床转化潜力大 | 材料生物相容性好,适配个性化新抗原疫苗开发 |
五、Absin:助力科研,赋能免疫治疗突破
Absin 始终聚焦生命科学前沿,提供高品质免疫学、细胞生物学、分子生物学试剂,本次 abs90142 助力顶刊研究,是产品实力的有力证明。
Absin abs90142 小鼠淋巴细胞分离液
| 货号 | abs90142 |
| 用途 | 小鼠外周血、脾脏、淋巴结等组织淋巴细胞高效分离 |
| 优势 | 纯度高、活率高、低内毒素、操作简便 |
结语
Aze Chol NP 疫苗平台为肿瘤免疫治疗开辟新方向,Absin 将持续以优质试剂 + 专业服务,助力更多科研团队实现从基础研究到临床转化的跨越,共同攻克肿瘤治疗难题!

- 手机:13761418683