




- 手机:13761418683
联系人:爱必信
网址:http://www.absin.cn/
地 址:上海市浦东新区新浩路58号18号楼

- 膀胱癌是全球高发泌尿系恶性肿瘤,约 70% 患者对 PD-1/PD-L1 免疫治疗响应不佳。
- 慢性炎症与肿瘤免疫微环境(TME)重塑是免疫逃逸核心,但炎症相关基因 RRBP1在膀胱癌免疫调控中的作用尚不明确。
- 研究团队聚焦RRBP1,探索其调控肿瘤进展、免疫逃逸及免疫治疗抵抗的机制,寻找增敏免疫检查点抑制剂的新方案。
- 整合转录组、蛋白质组、体内 anti-PD-L1 CRISPR 筛选数据,从炎症相关基因中筛选出RRBP1为核心候选基因。
- 临床队列验证:RRBP1 在膀胱癌组织高表达,与病理分级、分期、不良预后、免疫治疗耐药显著相关(图 1)。
- 体外:shRNA 敲低 / 药物(Radezolid)抑制 RRBP1,显著抑制膀胱癌细胞增殖、迁移、侵袭(图 2)。
- 体内:构建皮下移植瘤与肺转移模型,证实RRBP1 抑制可缩小肿瘤、减少肺转移灶(图 2)。
- 测序 + 流式 + 多重免疫荧光:RRBP1 抑制上调免疫通路,增加CD8+T 细胞浸润,减少耗竭性 T 细胞(图 3、图 4)。
- 临床免疫治疗队列:低 RRBP1组 anti-PD-L1 治疗响应率更高(图 3)。
- RRBP1 直接结合CXCL10 mRNA并降低其稳定性;抑制 RRBP1→CXCL10 分泌↑→结合 CD8+T 细胞表面 CXCR3→促进 IFN-γ、Granzyme B 释放(图 5、图 6)。
- 抑制 RRBP1 联合 anti-PD-L1,协同抑制肿瘤生长,进一步提升 CD8+T 细胞浸润与功能(图 7)。
- 结论:RRBP1 是膀胱癌预后标志物与免疫治疗增敏靶点。
- 产品名称:D - 荧光素钠盐
- 货号:abs42017259
- 用途:萤火虫荧光素酶底物,用于体内生物发光成像
-
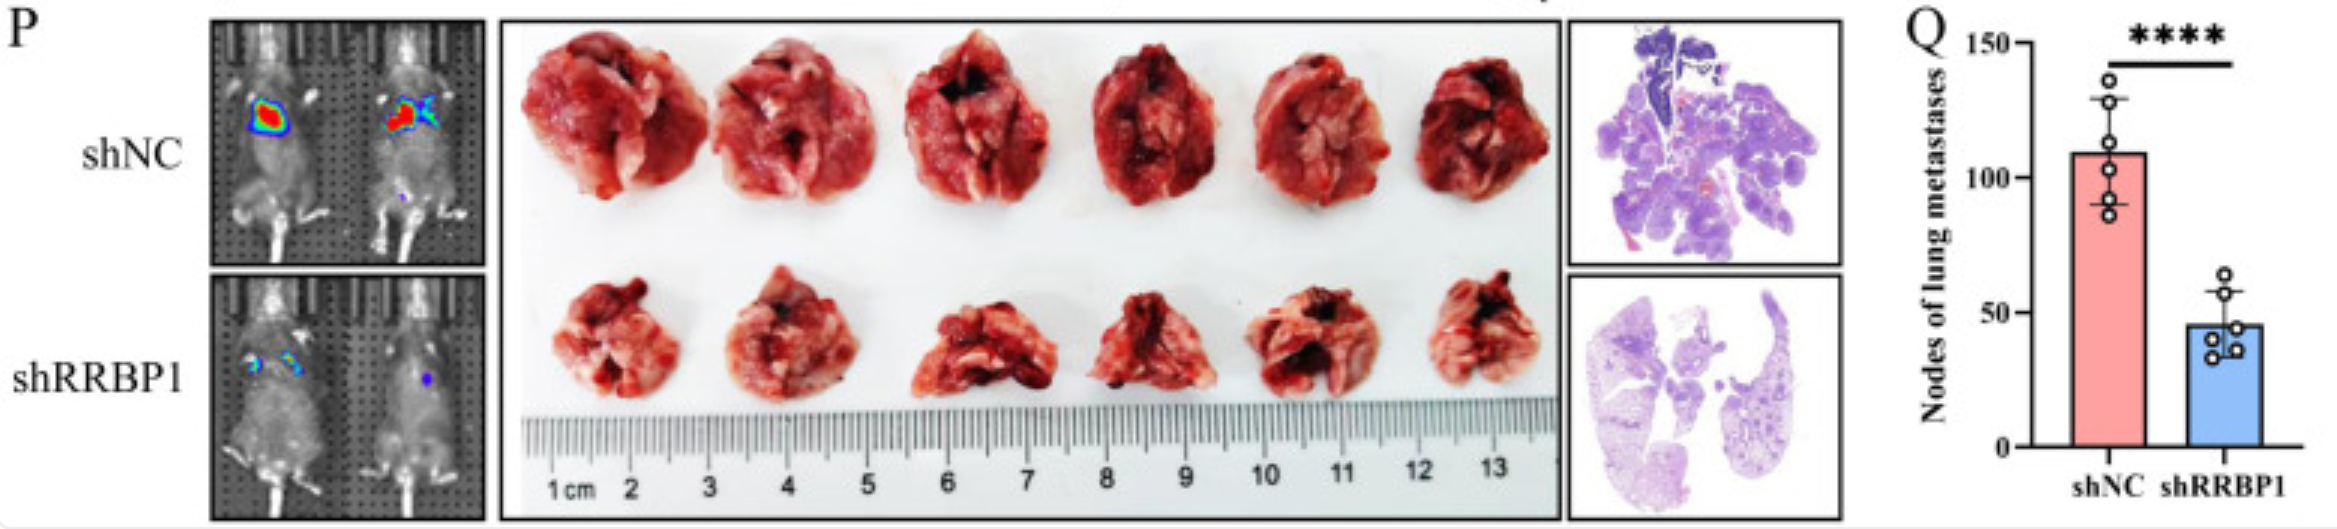
对应实验:小鼠尾静脉注射荧光素酶标记肿瘤细胞,腹腔注射 abs42017259 后,用 IVIS 系统活体成像,检测肺转移灶与皮下肿瘤生长(原文图 2P、Q)。
- 高水溶性:易配制成高浓度溶液,适合体内注射。
- 高纯度低杂质:HPLC 纯度达标,背景信号低,成像信噪比优异。
- 发光稳定:与荧光素酶反应高效,光信号强且持续,满足长时间成像需求。
- 批次稳定:减少实验误差,保障体内成像数据可重复。
- RRBP1是膀胱癌炎症 - 免疫调控关键基因,高表达提示预后差、免疫治疗耐药。
- RRBP1 通过降低 CXCL10 mRNA 稳定性抑制 CD8+T 细胞浸润与活化,介导免疫逃逸。
- 靶向 RRBP1可重塑肿瘤免疫微环境,增敏 anti-PD-L1 免疫治疗。
- Absin abs42017259 为体内肿瘤成像提供稳定、可靠的底物支持,助力关键表型验证。
顶刊新发现:靶向 RRBP1 可逆转膀胱癌免疫逃逸,解锁肿瘤免疫治疗潜在靶点
2026-07-08
近期,青岛大学附属医院团队在Journal for Immunotherapy of Cancer发表重磅研究,系统阐明RRBP1通过调控CXCL10-CXCR3 轴介导膀胱癌免疫逃逸、影响 PD-L1 抑制剂疗效的分子机制,为膀胱癌精准免疫治疗提供全新靶点与策略。
作为生命科学领域优质试剂提供商,Absin(爱必信) 旗下D - 荧光素钠盐(abs42017259) 全程支撑该研究关键体内成像实验,用稳定品质助力科研成果落地。
文献标题:Targeting RRBP1 reverses immune evasion and enhances immunotherapy efficacy via the CXCL10-CXCR3 axis in bladder cancer
发表期刊:J Immunother Cancer. (IF=10.6)
DOI:https://doi.org/10.1136/jitc-2025-013809
使用 Absin 产品:D-荧光素钠盐(货号:abs42017259)

一、研究背景:膀胱癌免疫治疗遇阻,亟需新靶点破局
二、完整研究思路:从筛选到验证,层层递进
1. 靶点筛选:锁定炎症 - 免疫关键基因 RRBP1
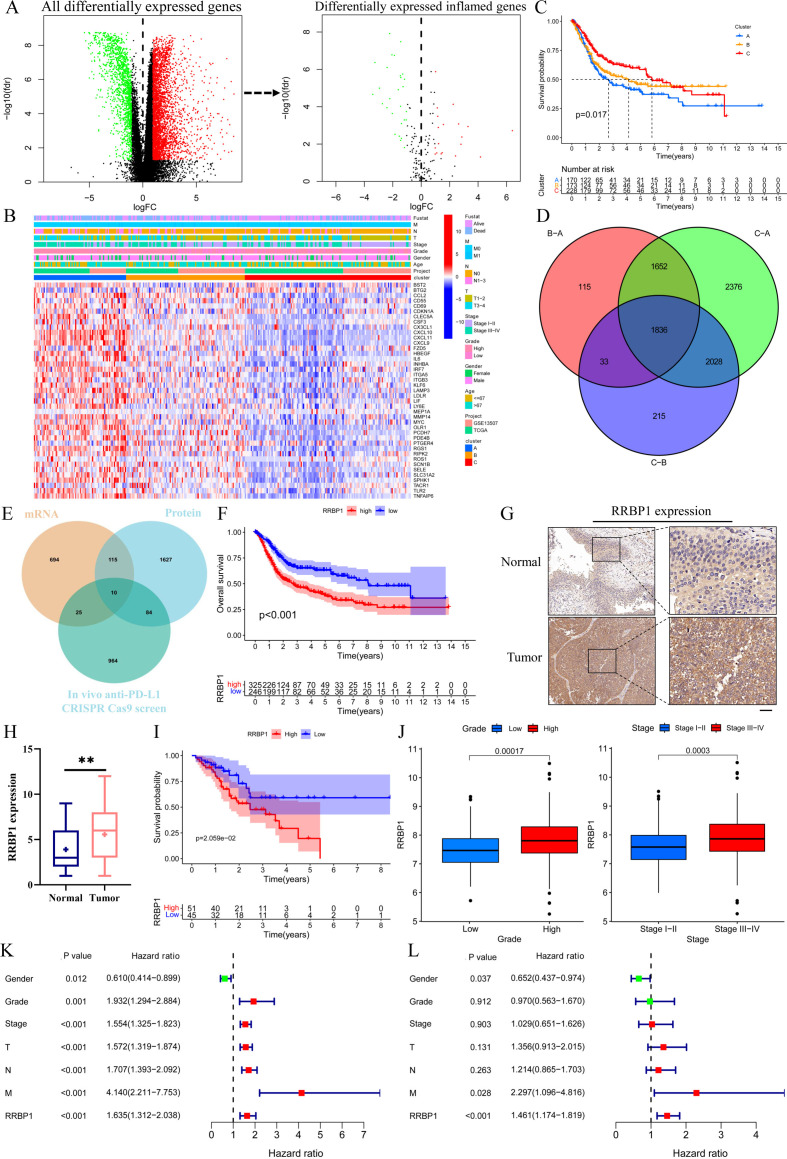
Figure 1. Identification of RRBP1 was an immune-inflammation-associated gene in BC. (A) The differentially expressed inflammation genes between BC and normal tissues. (B) Unsupervised clustering of differentially expressed inflammation genes in the TCGA and GEO BC cohorts. (C) Survival analysis for the three inflammation clusters based on 571 patients from the TCGA-BLCA cohort and GSE13507 cohorts including cluster A (n=170), cluster B (n=173), and cluster C (n=228). (D) The differentially expressed inflammation-associated genes among three clusters. (E) Integrating mRNA results with previous proteomic data and in vivo anti-PD-L1 antibody CRISPR Caa9 screening data to screen differentially expressed inflammation-immune-associated genes. (F) Survival analysis for RRBP1 expression based on 571 patients from TCGA and GSE13507 BC cohorts. (G) Representative images of IHC staining for RRBP1 protein in BC tissues and normal tissues. Scale bars: 50 μm. (H) The expression level of RRBP1 was analyzed in 96 BC tissues and 30 normal tissues by IHC staining. (I) Survival analysis for RRBP1 protein expressed based on 96 patients from in-house BC cohort. (J) The expression level of RRBP1 in the different grade and stage of patients with BC based on 311 patients from TCGA and GEO BC cohorts. (K, L) Univariate and multivariate analyses showed that ENO1 was an independent prognostic factor in the TCGA and GEO BC cohorts. Data are represented as mean means±SD. Statistical analysis was performed using unpaired two-tailed t-test (H) or Kaplan-Meier survival analysis and log-rank test (I). **p<0.01. BC, bladder cancer; BLCA, bladder urothelial carcinoma; IHC, immunohistochemistry; GEO, Gene Expression Omnibus; mRNA, messenger RNA; PD-L1, programmed death-ligand 1; RRB1, ribosomal-binding protein 1; TCGA, The Cancer Genome Atlas.
2. 功能验证:RRBP1 驱动膀胱癌增殖与转移
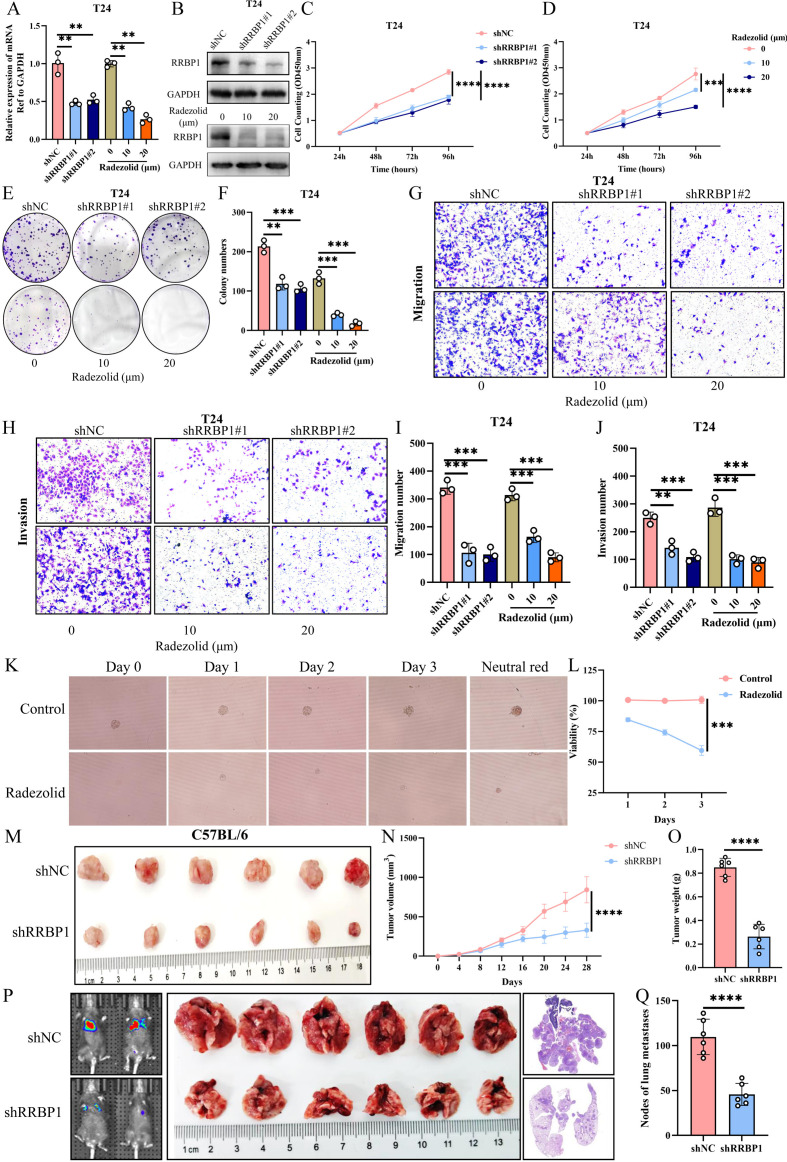 Figure 2. RRBP1 promotes the proliferation and metastasis of BC in vitro. (A, B) The expression of RRBP1 in T24 and MB49 cells after genetic inhibition with shRNA and pharmacological inhibition with radezolid was analyzed by RT-qPCR and western blot assays. (C–F) The effect of RRBP1 inhibition on BC cell proliferation was evaluated by CCK8 and colony formation assays. (G–J) The effect of RRBP1 inhibition on BC cell migration and invasion was analyzed by Transwell assays. The data presented represent three independent experiments. (K, L) The fitting curve of the cell growth inhibition rate was used to show the sensitivity of PDO to radezolid. (M–O) C57BL/6 mice were subcutaneously injected with 5×10⁵ stable MB49 cells (shNC or shRRBP1 cells) followed by measurement of tumor sizes (M), volumes (N), and weights (O) (n=6). (P, Q) C57BL/6 mice were injected with luciferase-labeled shNC or shRRBP1 MB49 cells via the tail vein (n=6) followed by measurement of experimental lung metastases growth. Images and H&E staining of lung metastases. Data are represented as mean means±SD. Statistical analysis was performed using unpaired two-tailed t-test (A, C–F, I, J, L, N, O, Q). **p<0.01, ***p<0.001, ****p<0.0001. BC, bladder cancer; RRB1, ribosomal-binding protein 1; PDO, patient-derived organoids; RT-qPCR, reverse transcription quantitative real-time polymerase chain reaction.
3. 免疫微环境重塑:RRBP1 抑制激活抗肿瘤免疫
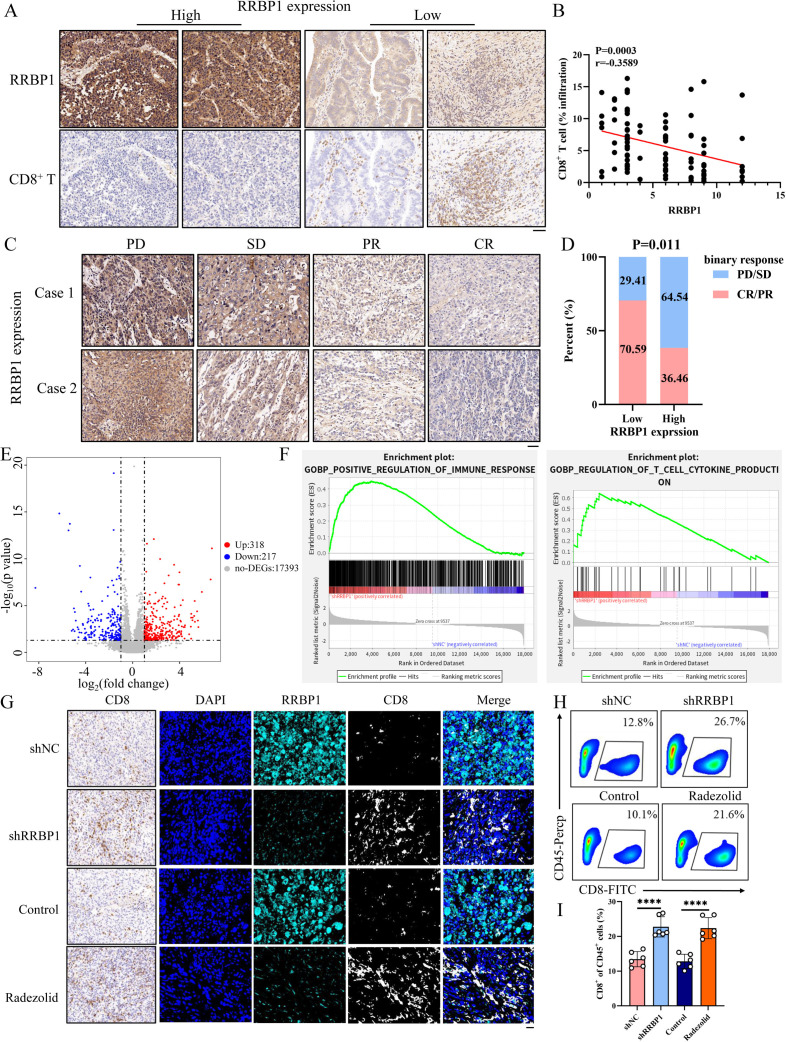 Figure 3. Tumor-intrinsic RRBP1 inhibition triggers antitumor immunity. (A) Representative images of IHC staining for RRBP1 and CD8+ T cells in BC samples. (B) The correlation between RRBP1 expression and CD8+ T-cell infiltration was analyzed based on 96 patients from in-house BC cohort. Scale bar: 50 μm. (C) Representative images of IHC staining for RRBP1 expression in PD, SD, PR, and CR samples. Scale bar: 50 μm. (D) Bar plot showed the response rates of anti-PD-L1 therapy. Blue bars represent CR/PR, Red bars represent PD/SD. (E) Volcano plot of RNA-seq data for shNC or shRRBP1 tumors (n=3). Differentially expressed genes were identified with the threshold of |log2 (fold change) | >1 and FDR<0.05. (F) GSEA for DEGs showed the activation of immune-associated pathways in shRRBP1 tumors in the RNA-seq data. (G) Representative images of IHC and mIHC staining for RRBP1 and CD8+ T cells in shNC, shRRBP1, control or radezolid tumor tissues. Expression levels of the indicated proteins were displayed. Scale bar: 20 μm. (H, I) Flow cytometry showed the percentages of CD8+ T cells in CD3+ cells in shNC, shRRBP1, control or radezolid tumor tissues. Data are represented as mean means±SD. Statistical analysis was performed using Spearman correlation analysis (B), unpaired two-tailed t-test (I). ****p<0.0001. BC, bladder cancer; CR, complete response; FDR, false discovery rate; progressive disease; PR, partial response; PD-L1, programmed death-ligand 1; RNA-seq, RNA sequencing; RRB1, ribosomal-binding protein 1; SD, stable disease; IHC, immunohistochemistry; GSEA, gene set enrichment analysis; DEGs, differentially expressed genes; mIHC, multiplex immunohistochemistry.
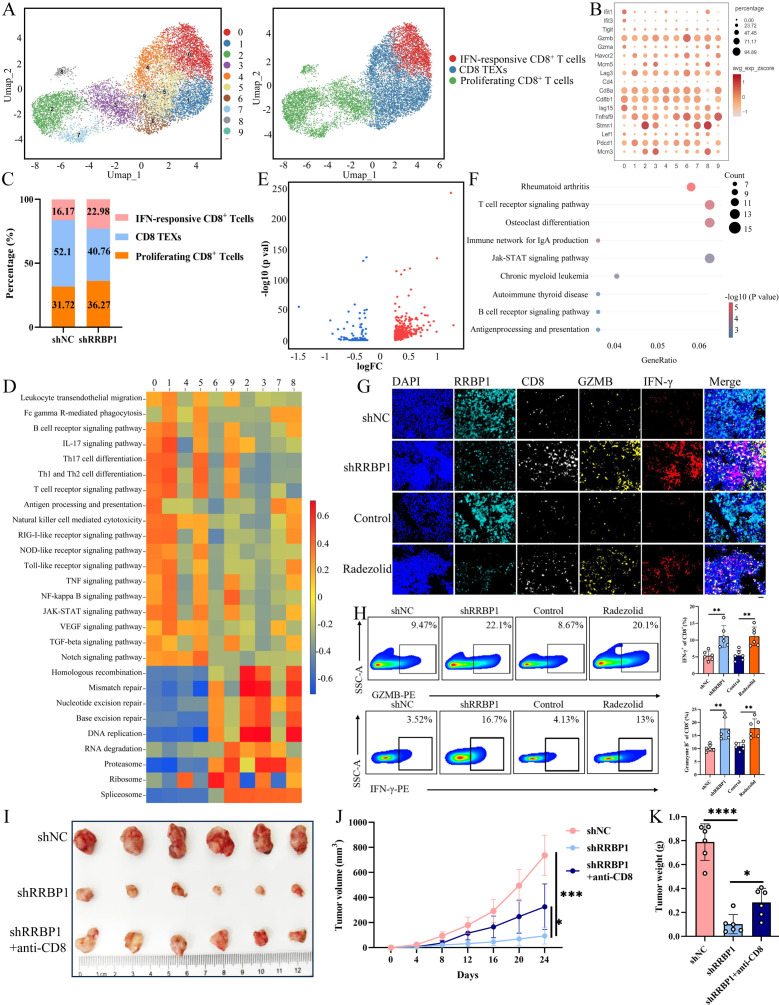 Figure 4. Single-cell RNA sequencing reveals the difference of CD8+ T-cell subgroup. The UMAP plot of CD8+ T cells subpopulation, color-coded by cell cluster and cell type. (A) The expression of markers in each CD8+ T cells subpopulation. (B) Bar plot showed the proportion of CD8+ T cells subpopulation in the shNC and shRRBP1 groups. (C) The percentage of each CD8+ T-cell clusters in shNC and shRRBP1 groups. (D) Heatmap showed the differentially activated pathway among all the CD8+ T-cell clusters. (E) The differentially expressed genes in CD8+ T cells between shNC and shRRBP1 groups. (F) KEGG analysis for differentially expressed genes showed the enrichment of immune-associated pathways. (G, H) mIHC and flow cytometric analysis displayed the tumor-infiltrating IFN-γ+ or GZMB+ CD8+ T cells in shNC or shRRBP1 tumor tissues. Scale bar: 20 μm. (I–K) C57BL/6 mice were subcutaneously injected with 5×10⁵ stable MB49 cells (shNC or shRRBP1 cells) (n=6). Isotype control (IgG) or anti-mouse CD8 antibody administered on days –6, –3, and –1 before tumor challenge, with the same dose repeated on days 7, 9 and 11 after tumor challenge. Tumor sizes (I), volumes (J), and weight (K) were measured. Data are represented as mean means±SD. Statistical analysis was performed using unpaired two-tailed t-test (H, K) and two-way ANOVA with Tukey's multiple comparison test (J). *p<0.05, **p<0.01, ***p<0.001, ****p<0.0001. ANOVA, analysis of variance; GZMB, Granzyme B; IFN, interferon; TEX, exhausted T cells; UMAP, Uniform Manifold Approximation and Projection; mIHC, multiplex immunohistochemistry; KEGG, Kyoto Encyclopedia of Genes and Genomes.
4. 机制深挖:CXCL10-CXCR3 轴是关键通路
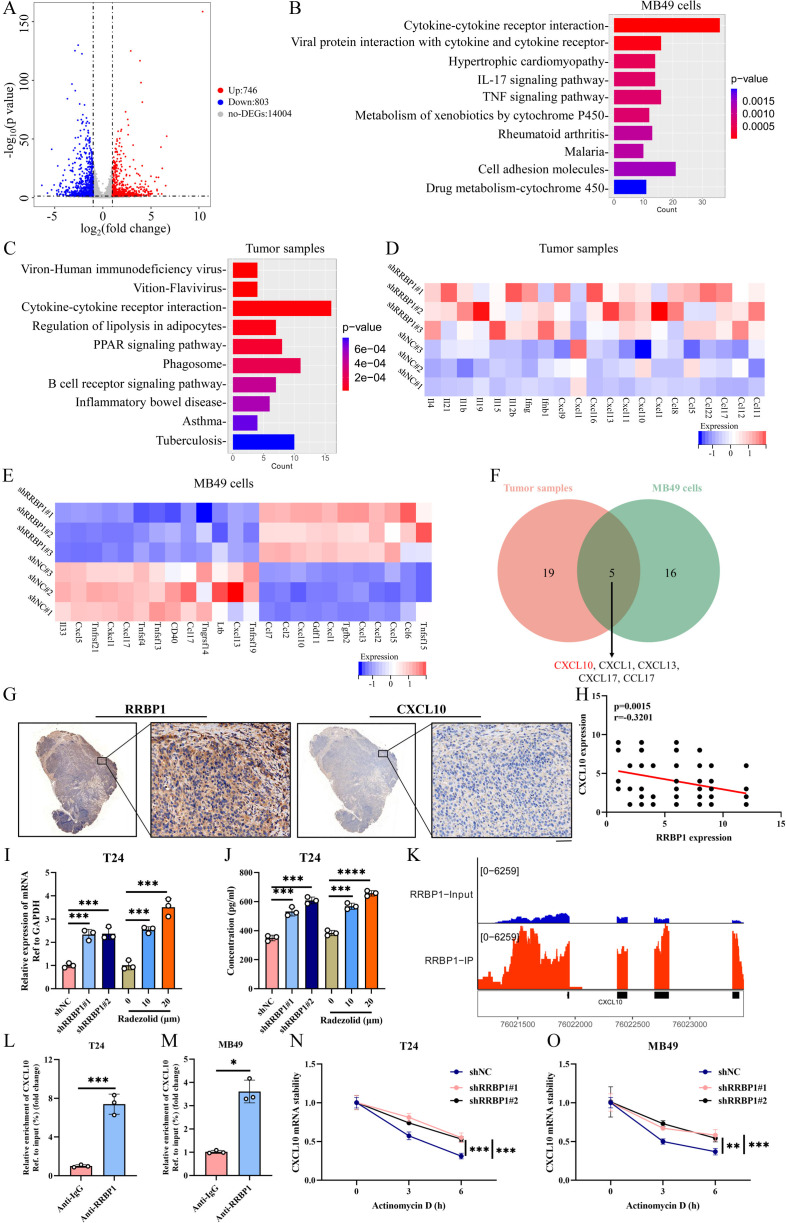 Figure 5. RRBP1 inhibition increases the CXCL10 mRNA stability in BC. (A) The volcano plot showed that differentially expressed genes regulated by RRBP1 inhibition in MB49 cells. (B) KEGG analysis for differentially expressed genes found enrichment signaling pathways in MB49 cells. (C) KEGG analysis for differentially expressed genes found enrichment signaling pathways in tumor samples. (D, E) Heatmap displays the expression changes of cytokines after RRBP1 inhibition in MB49 cells and tumor tissues. (F) The Venn diagram illustrates the differentially expressed cytokines in both MB49 cells and tumor tissues after inhibition of RRBP1. (G) Representative images of IHC staining for RRBP1 and CXCL10 expression in BC samples. (H) The correlation between RRBP1 expression and CXCL10 expression was analyzed based on 96 patients from in-house BC cohort. Scale bar: 50 μm. (I) The mRNA expression of CXCL10 after genetic or pharmacological inhibition of RRBP1 in T24. (J) ELISA analysis of CXCL10 expression after genetic or pharmacological inhibition of RRBP1 in T24. (K) Distribution of RRBP1-binding peaks across CXCL10 by integrative genomics Viewer. (L, M) RIP analyses of MB49 cells or T24 cells were performed with an anti-RRBP1 antibody followed by qPCR analyses with primer against CXCL10 mRNA. (N, O) Knockdown of ENO1 to detect the CXCL10 mRNA expression levels in MB49 cells or T24 cells that were treated with actinomycin D for the indicated time. Data are represented as mean means±SD. Statistical analysis was performed using unpaired two-tailed t-test (I, J, L, M, N, O) or Spearman correlation analysis (H). The data presented represent one or three independent experiments. *p<0.05, ***p<0.001. BC, bladder cancer; mRNA, messenger RNA; qPCR, quantitative PCR; RRB1, ribosomal-binding protein 1; IHC, immunohistochemistry; KEGG, Kyoto Encyclopedia of Genes and Genomes.
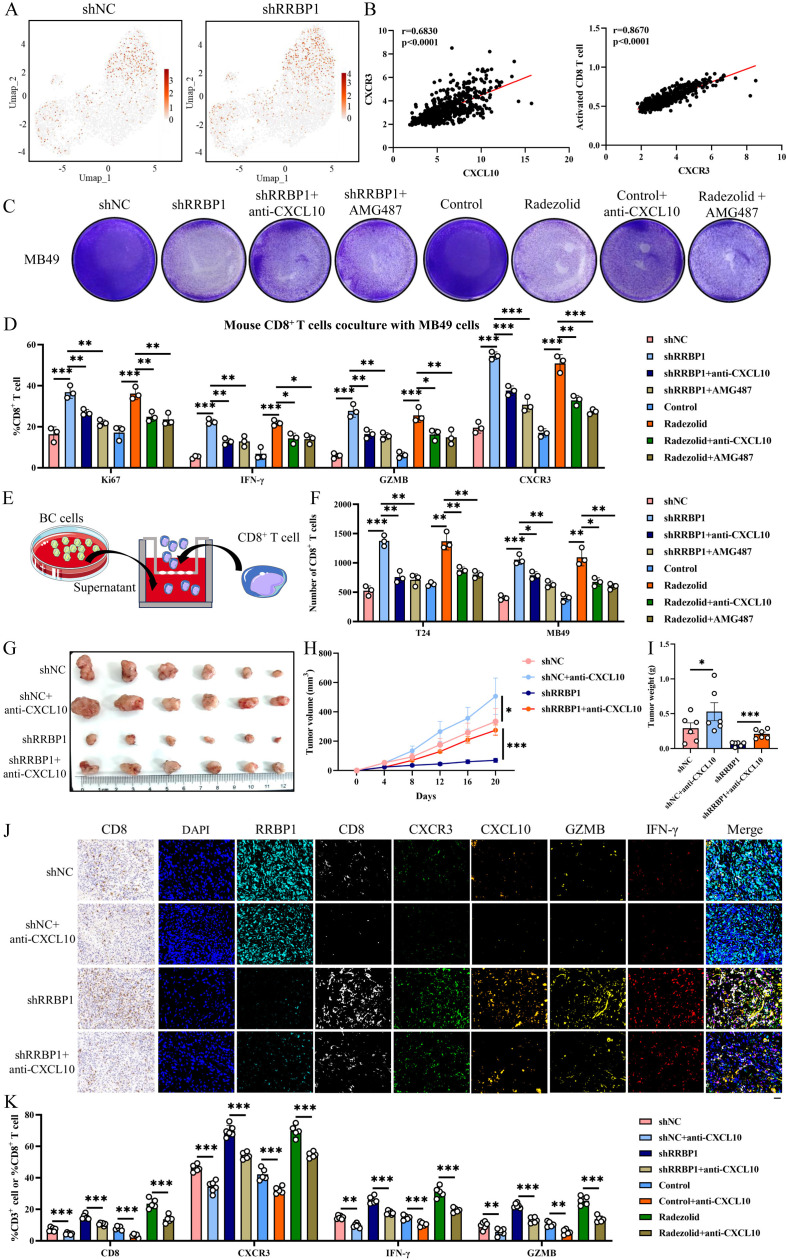 Figure 6. RRBP1 inhibition promotes antitumor immunity via the CXCL10-CXCR3 axis in BC. (A) ScRNA-seq data showed the CXCR3 expression of CD8+T cells in shNC and shRRBP1 groups. (B) The correlation between CXCR3 expression and CXCL10 expression or activated CD8+ T cell based on 571 patients from TCGA-BLCA cohort and GSE13507 cohorts. (C) MB49 cells were co-cultured with CD8+ T cells, and tumor cells were stained with crystal violet. (D) Evaluation of the effect of genetic inhibition of RRBP1 on the cytotoxicity of CD8+ T cells in vitro conditioned culture model. (E) Schematic diagram of in vitro CD8+ T-cell migration assays. (F) The number of CD8+ T cells passing through the membrane of a Transwell system was analyzed by flow cytometry. (G–I) C57BL/6 mice were subcutaneously injected with 5×10⁵ stable MB49 cells (shNC or shRRBP1 cells) (n=6). Tumor-bearing mice received intraperitoneal injection of either vehicle or anti-CXCL10 when the tumor volume reached a calculated average of 100 mm3. The tumor sizes (G), volumes (H), and weights (I) were measured. (J) Representative images of IHC and mIHC staining for CD8, CXCR3, CXCL10, IFN-γ, GZMB in different tumor tissues. (K) Flow cytometric analysis of tumor-infiltrating CD8+ T cells, CXCR3+ CD8+ T cells, IFN-γ+ CD8+ T cells or GZMB+ CD8+ T cells in distinct tumor tissues. Data are represented as mean means±SD. Statistical analysis was performed using unpaired two-tailed t-test (D, F, I, K) and two-way ANOVA with Tukey's multiple comparison test (H). The data presented represent on one or three independent experiments. *p<0.01, **p<0.01, ***p<0.001. ANOVA, analysis of variance; BC, bladder cancer; GZMB, Granzyme B; IFN, interferon; RRBP1, ribosomal-binding protein 1; scRNA-seq, single-cell RNA sequencing; IHC, immunohistochemistry; mIHC, multiplex immunohistochemistry; BLCA, bladder urothelial carcinoma.
5. 治疗转化:靶向 RRBP1 增敏 anti-PD-L1 免疫治疗
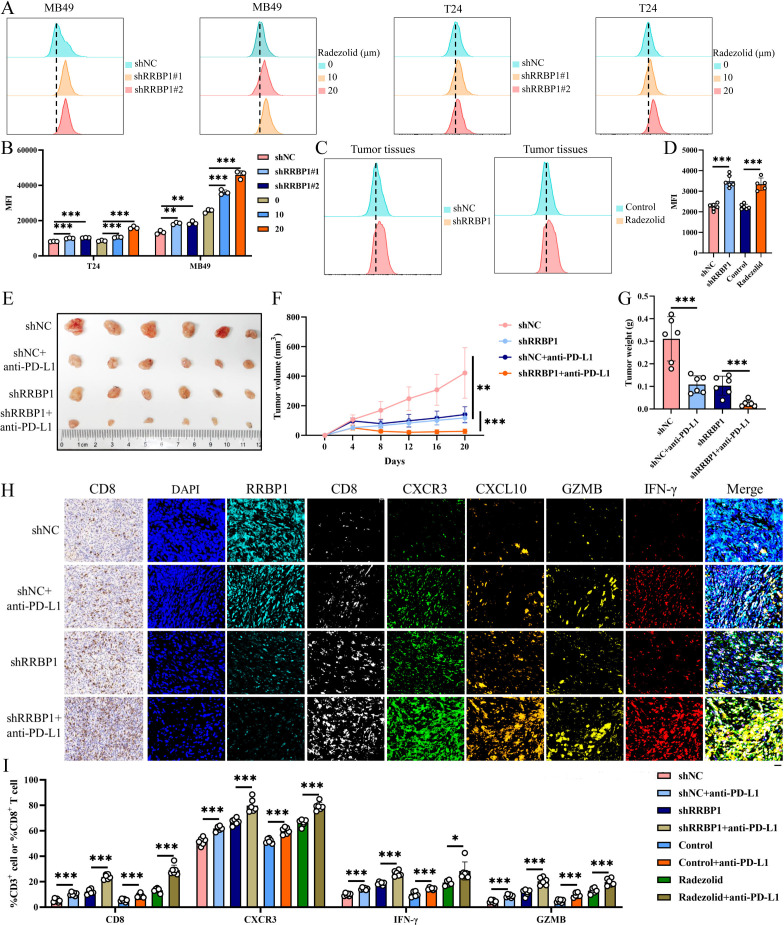 Figure 7. RRBP1 inhibition enhances response to anti-PD-L1 therapy in BC. (A–D) The protein expression of surface PD-L1 was analyzed in BC cells or tumor tissues by flow cytometry after RRBP1 inhibition and was shown as the mean fluorescence intensity. (E–G) C57BL/6 mice were subcutaneously injected with 5×10⁵ stable MB49 cells (shNC or shRRBP1 cells) (n=6). Tumor-bearing mice were received intraperitoneal injection of either vehicle or anti-PD-L1 antibody when the tumor volume reached a calculated average of 100 mm3. The tumor sizes (E), volumes (F), and weights (G) were measured. (H) Representative images of IHC and mIHC staining for CD8, CXCR3, CXCL10, IFN-γ, GZMB in different tumor tissues. (I) Flow cytometric analysis of tumor-infiltrating CD8+ T cells, CXCR3+ CD8+ T cells, IFN-γ+ CD8+ T cells or GZMB+ CD8+ T cells in distinct tumor tissues. Data are represented as mean means±SD. Statistical analysis was performed using unpaired two-tailed t-test (B, D, G, I) and two-way ANOVA with Tukey's multiple comparison test (F). The data presented represent on one or three independent experiments. *p<0.01, **p<0.01, ***p<0.001. ANOVA, analysis of variance; BC, bladder cancer; GZMB, Granzyme B; IFN, interferon; PD-L1, programmed death-ligand 1; RRBP1, ribosomal-binding protein 1; IHC, immunohistochemistry; mIHC, multiplex immunohistochemistry.
三、Absin 核心产品支撑:abs42017259 助力关键体内成像
该研究中,团队使用Absin abs42017259(D Luciferin sodium salt,D - 荧光素钠盐) 完成小鼠活体肿瘤成像,精准量化肿瘤负荷与转移水平,为结论提供可靠数据支撑。
? 产品信息
? 产品核心优势
四、研究核心成果速览
五、Absin 助力科研,持续赋能肿瘤免疫研究
Absin 始终以高品质试剂 + 稳定性能支撑全球科研团队,本次助力 JITC 顶刊研究,再次印证 Absin 产品在肿瘤生物学、免疫治疗、动物模型等领域的可靠表现。

- 手机:13761418683