




- 手机:13761418683
联系人:爱必信
网址:http://www.absin.cn/
地 址:上海市浦东新区新浩路58号18号楼

- 筛选高效氨基富勒烯衍生物TAPC,精准靶向VEGFR2,阻断下游PI3K AKT信号,抑制血管生成;
- 构建肿瘤细胞膜包裹纳米粒TAPC@CNPs,提升稳定性、延长循环、实现肿瘤靶向富集;
- 同步实现抗血管生成+重塑肿瘤免疫微环境,达成"断粮+激活免疫"双重抗癌效果。
- 表型筛选确认TAPC为最优抗血管生成氨基富勒烯,显著抑制HUVEC管形成、鸡胚绒毛尿囊膜血管生成(原文图1);
- 机制证实:TAPC直接结合VEGFR2,下调其表达与磷酸化,阻断PI3K AKT STAT3通路,抑制肿瘤代谢(糖酵解)(原文图3)。
- 以PLGA为核、肿瘤细胞膜为壳,粒径~106 nm,血清/储存双稳定,pH响应释药(酸性肿瘤微环境释放更快)(原文图4);
- 体内循环半衰期≈13.1 h,高效富集于肿瘤组织(原文图6)。
- 结直肠癌小鼠模型中,TAPC@CNPs抑瘤率超60%,显著降低VEGFR2、CD31(血管密度标志物)表达(原文图5);
- 降低调节性T细胞(Tregs)比例,提升CD8+ T细胞浸润与IFN γ分泌,逆转免疫抑制(原文图7);
- 无明显脏器毒性,安全性优异。
- 高灵敏捕获弱信号:精准识别肿瘤细胞/组织中VEGFR2及下游蛋白的微弱表达变化,确保机制数据真实可靠;
- 低背景无干扰:避免非特异性条带干扰,条带清晰锐利,支撑顶刊图表质量;
- 信号稳定持久:发光窗口长,支持多次曝光,保证实验重复性与结果可追溯;
- 兼容主流体系:适配PVDF膜、CCD成像系统,完美匹配团队实验流程。
- 试剂稳定=实验可靠;
- 信号清晰=数据可信;
- 选择Absin=选择顶刊标准。
顶刊Bioact Mater.发文揭秘|氨基富勒烯纳米平台双效抗癌
2026-07-09
近期,国际顶级期刊《Bioactive Materials》在线发表了来自中科院化学所等单位的重磅研究——氨基富勒烯基纳米平台实现VEGFR2靶向抗血管生成+肿瘤免疫治疗协同增效,为结直肠癌等实体瘤治疗提供全新策略。
作为生命科学领域优质试剂提供商,Absin全程关注科研突破,本文将从研究思路、核心成果、关键试剂价值三维度深度解读,重点解析Absin abs920(增强型化学发光试剂盒)如何为顶刊数据保驾护航。
文献标题:Aminated fullerene-based nanoplatform enables synergistic VEGFR2-targeted anti-angiogenesis and tumor immunotherapy
发表期刊:Bioact Mater. (IF=20.3)
DOI:https://doi.org/10.1016/j.bioactmat.2026.03.016
使用 Absin 产品:ECL化学发光检测试剂盒(货号:abs920)

一、研究核心思路:破解肿瘤两大"生存密码"
肿瘤进展离不开两大关键支撑:病理性血管生成(供氧供能)、免疫抑制微环境(逃避免疫攻击),二者相互促进,导致传统治疗效果大打折扣。
研究团队以此为切入点,设计"靶向抑制+仿生递送"双核心策略:
二、重磅研究成果:从分子机制到体内疗效全验证
1. 明星分子TAPC:强效抗血管生成,靶向VEGFR2
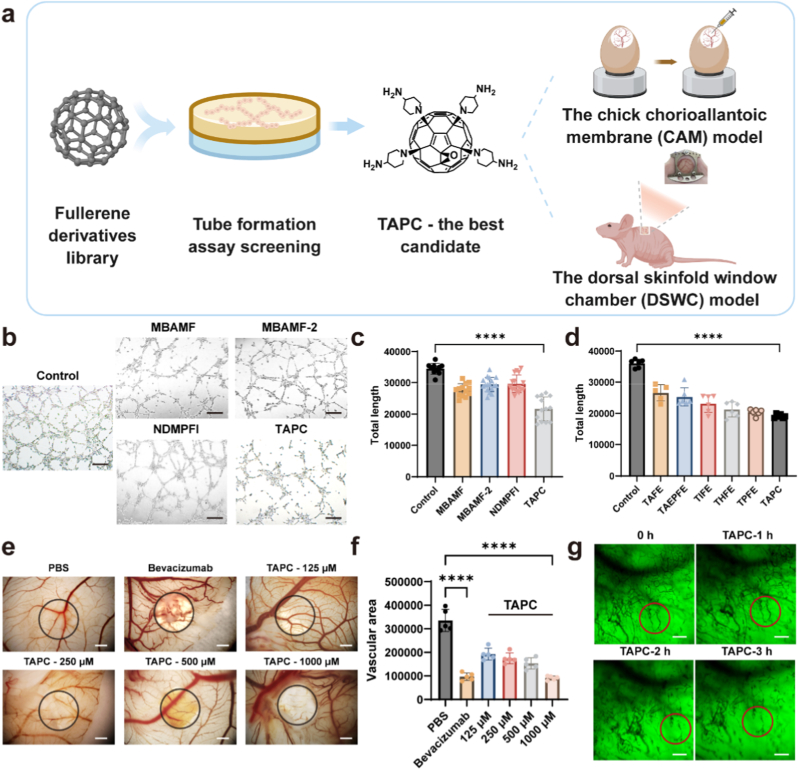
Fig. 1. Aminated fullerene exhibits potent anti-angiogenic activity. (a) Schematic workflow for screening aminated fullerene derivatives. Synthesized compounds were evaluated in a HUVEC tube formation assay. TAPC emerged as the lead anti-angiogenic candidate and was further validated using the CAM assay and DSWC model. (b) Representative images of capillary-like networks formed by HUVEC cells after treatment. Scale bar, 100 μm. (c-d) Quantification of total tube length in HUVEC cells. (e) CAM images 72 h post-topical treatment with TAPC (0.125-1 mM), bevacizumab (positive control), or PBS (control). Circular regions of interest (ROIs) denote avascular zones for vascular quantification Scale bar, 1 mm. (f) Quantified vascularized area within CAM ROIs, n = 5. (g) Intravital fluorescence imaging of tumor vasculature in the DSWC model post-intravenous TAPC injection. Red cycles indicate progressive microvessel rupture and hemorrhage. Scale bars, 1000 μm. Data are presented as mean ± SEM. Statistical analyses were performed using one-way ANOVA with Tukey's post hoc test, ????p < 0.0001.
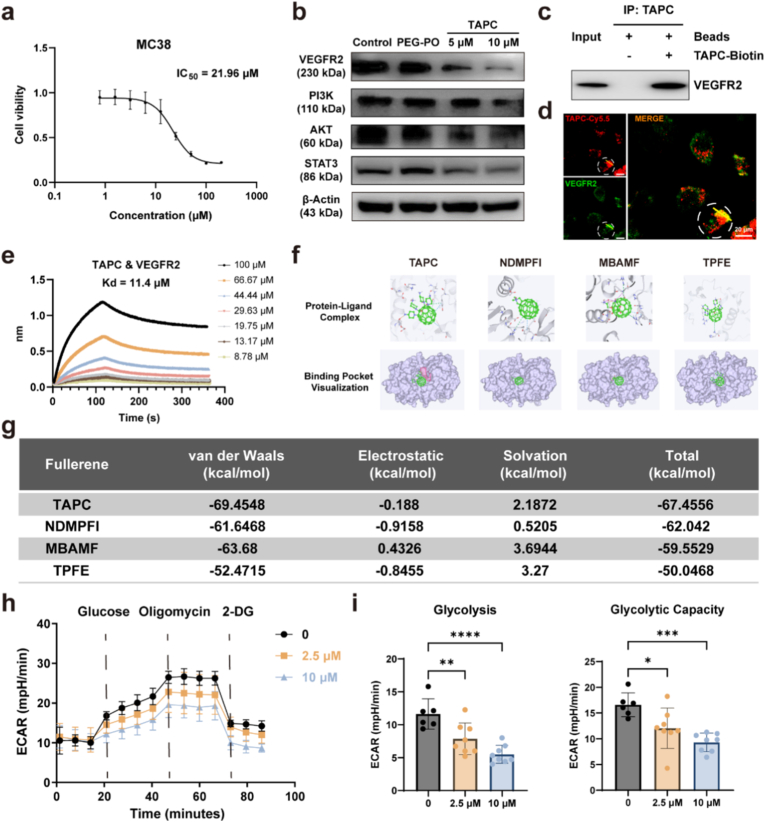
Fig. 3. TAPC interacts with VEGFR2 and modulates downstream signaling. (a) Cell viability assay of MC38 cells treated with increasing concentrations of TAPC. (b) Immunoblot analysis of VEGFR2 and key regulators of the PI3K–AKT signaling pathway (PI3K, AKT, and STAT3) in MC38 cells treated with PEG-PO or TAPC (5 and 10 μM). β-Actin was used as a loading control. (c) Pull-down assay of VEGFR2 from MC38 cell lysates using biotinylated TAPC, beads-only sample served as control. (d) Confocal IF imaging of MC38 cells incubated with Cy5.5-labeled TAPC and stained for VEGFR2, nuclei counterstained with DAPI. Scale bars: 20 μm. (e) BLI analysis of TAPC binding to recombinant VEGFR2 using serial concentrations (100, 66.7, 44.4, 29.6, 19.8, 13.2, and 8.8 μM). (f) Molecular dynamics simulations showing predicted protein–ligand complexes (top) and binding pocket visualizations (bottom) of VEGFR2 with TAPC, NDMPFI, MBAMF, and TPFE. (g) Binding free energy calculations of these complexes, including van der Waals, electrostatic, solvation, and total energy components. (h) Extracellular acidification rate (ECAR) of MC38 cells treated with control (0 μM), TAPC (2.5 μM), or TAPC (10 μM), with sequential addition of glucose, oligomycin, and 2-deoxyglucose (2-DG). (i) Quantification of glycolysis and glycolytic capacity in MC38 cells treated with control (0 μM), TAPC (2.5 μM), or TAPC (10 μM) (n = 8). Data are presented as mean ± SEM. Statistical significance was assessed using one-way ANOVA with Tukey's multiple comparisons test; ?p < 0.05, ??p < 0.01, ???p < 0.001, ????p < 0.0001.
2. 仿生纳米递送TAPC@CNPs:靶向增效,安全可控
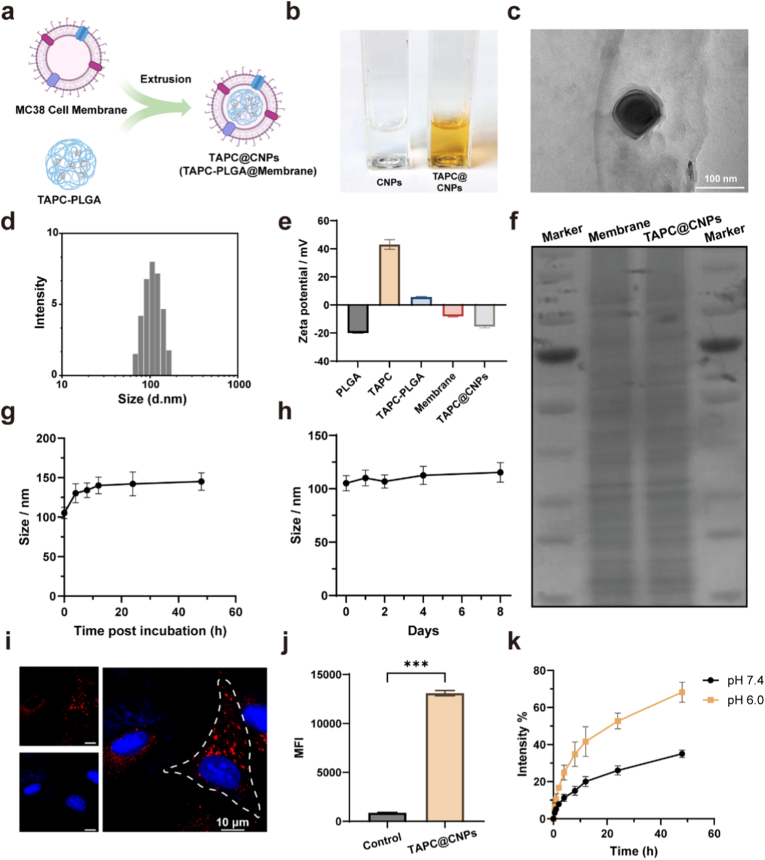 Fig. 4. Characterization and cellular uptake of TAPC@CNPs. (a) Schematic illustration of TAPC@CNP fabrication. (b) Photographs of nanoparticle suspensions of CNPs and TAPC@CNPs. (c) TEM image of TAPC@CNPs. Scale bar: 100 nm. (d) DLS hydrodynamic size distribution of TAPC@CNPs. (e) Zeta potential measurement of PLGA, TAPC, TAPC-PLGA, cell membranes and TAPC@CNPs. (f) SDS-PAGE/Coomassie staining of TAPC@CNPs and MC38 cell membranes. (g) Hydrodynamic size of TAPC@CNPs measured by DLS after incubation in 10% serum at 37 °C over time. (h) Hydrodynamic size of TAPC@CNPs measured by DLS during storage at 4 °C over the indicated days. (i) Confocal fluorescence images of MC38 cells incubated with Cy5.5-labeled TAPC@CNPs (red) for 6 h at 37 °C, nuclei were counterstained with DAPI (blue). The dashed line indicates the cell boundary. Scale bar: 10 μm. (j) Flow cytometry quantification of cellular uptake of Cy5.5-labeled TAPC@CNPs in MC38 cells after 6 h incubation, presented as MFI. (k) Release profile of TAPC-Cy5.5@CNPs at pH 7.4 and pH 6.0 over time, expressed as release percentage. Data are mean ± SEM. Statistical analysis by unpaired two-tailed t-test, ???p < 0.001.
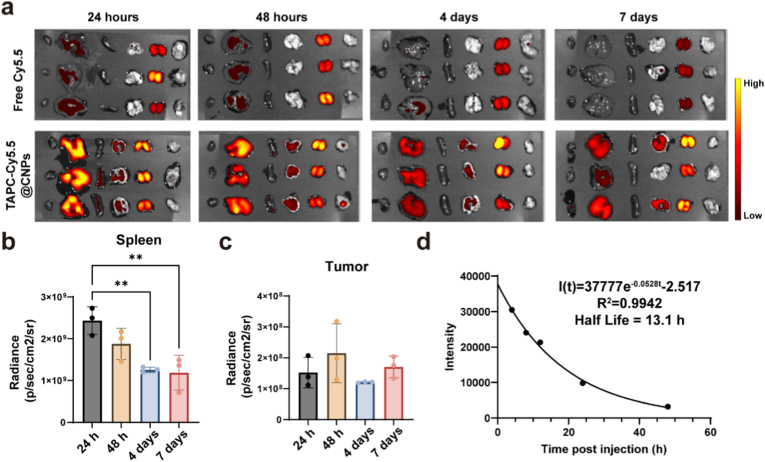 Fig. 6. Biodistribution and pharmacokinetic analysis of TAPC@CNPs. (a) Ex vivo fluorescence imaging of major organs and tumors collected at 24 h, 48 h, 4 days, and 7 days after intravenous injection of free Cy5.5 or Cy5.5-labeled TAPC@CNPs (n = 3). Organs are displayed from left to right in the following order: heart, liver, spleen, lung, kidney, and tumor. (b) Quantification of fluorescence intensity in spleen at the indicated time points. (c) Quantification of fluorescence intensity in tumors at the indicated time points. (d) Pharmacokinetic profile of Cy5.5-labeled TAPC@CNPs based on serum fluorescence intensity measured at different time points after intravenous injection. The data were fitted using a one-phase exponential decay model, and the calculated circulation half-life is shown. Data are presented as mean ± SEM. Statistical analysis was performed using one-way ANOVA with Tukey's multiple comparisons test, ??p < 0.01.
3. 体内抑瘤:血管抑制+免疫激活双管齐下
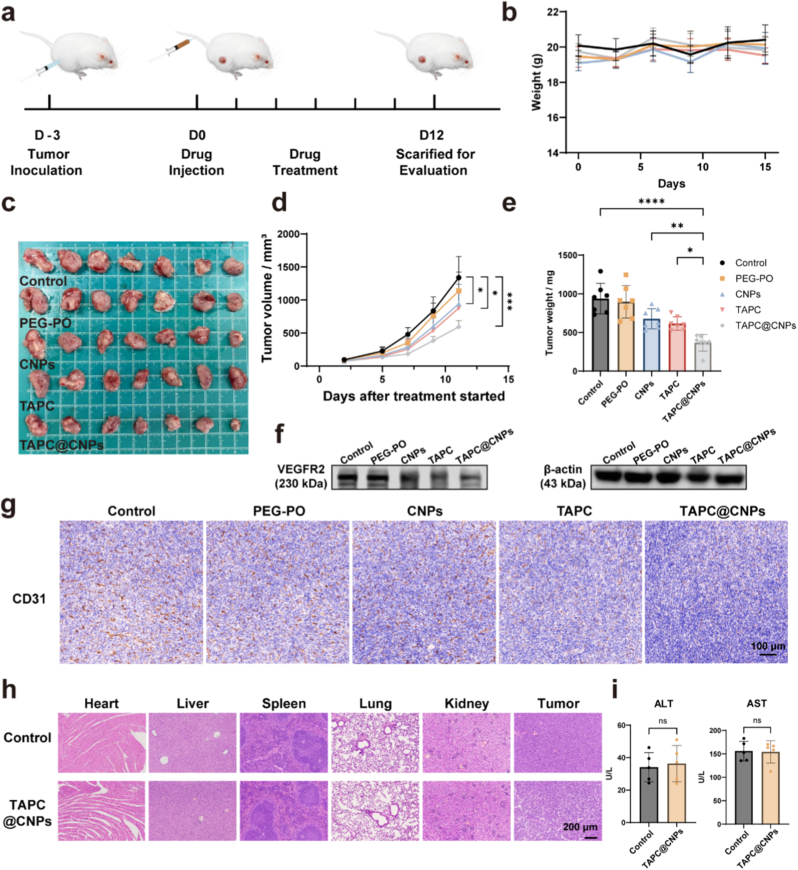 Fig. 5. In vivo anti-tumor and anti-angiogenic effects of TAPC@CNPs. (a) Schematic illustration of the therapeutic study in Balb/c mice bearing subcutaneous MC38 tumors (n = 7). (b) Body weights of mice during treatment. (c) Photographs of excised tumors collected at endpoint. (d) Tumor growth curves during treatment. Tumor volume was calculated using the formula (length × width2)/2. (e) Tumor weights measured at endpoint. (f) Immunoblot analysis of VEGFR2 expression in tumor lysates from different treatment groups, β-actin was used as a reference protein. (g) IHC staining of CD31 in tumor sections from different treatment groups. Scale bar, 100 μm. (h) H&E staining of major organs (heart, liver, spleen, lung, kidney) and tumor tissues. (i) Serum ALT and AST levels measured at endpoint. Data are presented as mean ± SEM. Statistical analysis was performed by one-way ANOVA with Tukey's multiple comparisons test, ns indicates not significant, ?p < 0.05, ??p < 0.01, ????p < 0.0001.
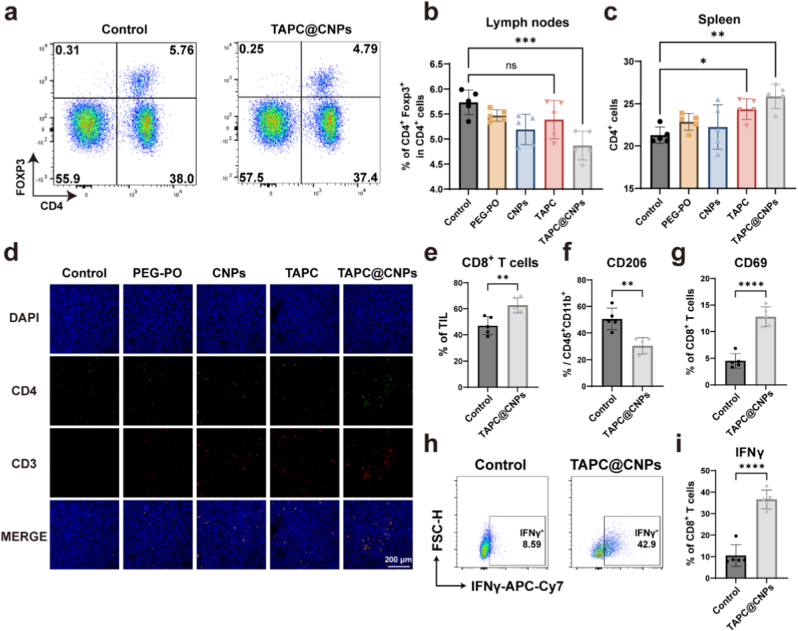 Fig. 7. Immune cell profiling in lymph nodes, spleen, and tumors following TAPC@CNP treatment. (a) Representative flow cytometry plots showing CD4 and Foxp3 expression in lymph node cells from Control and TAPC@CNP-treated groups. (b) Quantification of the percentage of CD4+Foxp3+ regulatory T cells among CD4+ T cells in lymph nodes from different treatment groups. (c) Quantification of the percentage of CD4+ T cells in spleen from different treatment groups. (d) IF staining of tumor sections for CD3+ T cells (red), CD4+ T cells (green), and nuclei (DAPI, blue) in different treatment groups. Scale bar, 200 μm. (e) Quantification of CD8+ T cells as a percentage of tumor-infiltrating lymphocytes (TILs) from Control and TAPC@CNP-treated groups. (f) Quantification of CD206 expression as a percentage of CD45+CD11b+ myeloid cells in tumor samples. (g) Quantification of CD69 expression in CD8+ T cells. (h) Representative flow cytometry plots showing intracellular IFNγ expression in CD8+ T cells from tumor samples. (i) Quantification of IFNγ+ CD8+ T cells from Control and TAPC@CNP-treated groups. Data are presented as mean ± SEM. Statistical analysis was performed using one-way ANOVA with Tukey's multiple comparisons test or unpaired two-tailed Student's t-test, ns, not significant, ?p < 0.05, ??p < 0.01, ???p < 0.001, ????p < 0.0001.
三、Absin abs920:顶刊Western Blot的"信号基石"
? 产品定位
Absin abs920 增强型化学发光试剂盒(ECL Luminescence Reagent),是Western Blot蛋白检测的高灵敏、低背景、长时效核心底物,适配HRP标记二抗催化发光。
? 在本研究中的关键作用(原文图3b、图5f)
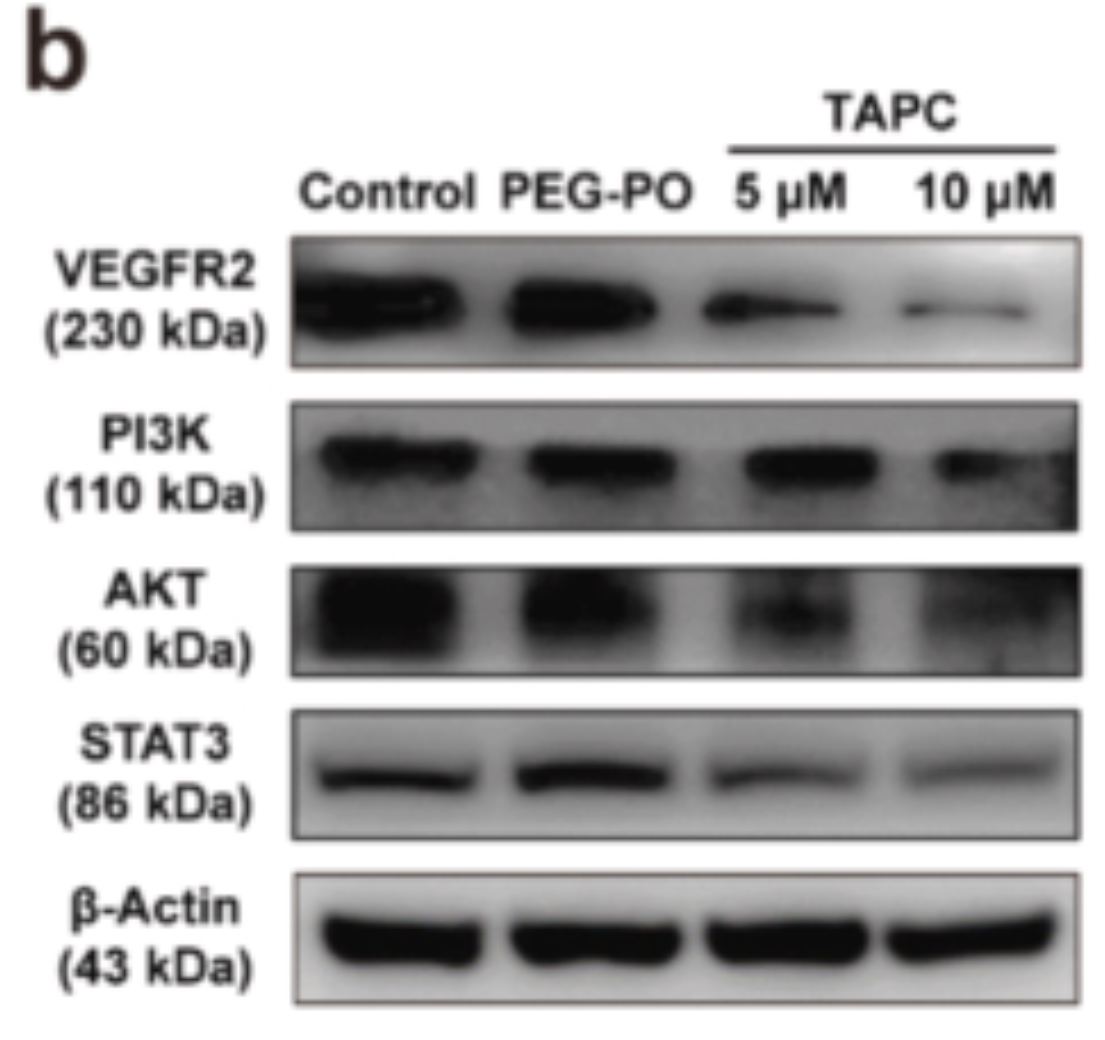

研究中需定量检测VEGFR2、PI3K、AKT、STAT3等关键信号蛋白表达,以验证TAPC对VEGFR2通路的调控作用:
简言之:abs920为全研究最核心的蛋白表达验证提供了"看得见、信得过、发得顶刊"的高质量信号输出,是机制结论成立的关键试剂支撑。
四、Absin与科研同行:助力更多顶刊突破
Absin始终以高品质试剂、稳定性能、全面支持,陪伴科研工作者攻克生命科学难题。本次abs920助力IF 20.3+顶刊发文,再次印证:

- 手机:13761418683