




- 手机:13761418683
联系人:爱必信
网址:http://www.absin.cn/
地 址:上海市浦东新区新浩路58号18号楼

Nature 子刊重磅!MYC 驱动 Z?DNA 形成重塑基因表达调控机制新发现
2026-07-20
近期,浙江大学方东团队在Nature Communications发表题为MYC drives left?handed Z?DNA formation to shape gene expression的研究论文,首次系统阐明癌蛋白 MYC 通过 FACT 复合物诱导左旋 Z?DNA 形成、直接调控 RNA 聚合酶 II 装载与转录激活的全新机制,为 MYC 驱动肿瘤的靶向治疗提供关键新思路。
作为生命科学试剂优质服务商,Absin(爱必信) 旗下核心产品吖啶橙染色液(abs9735) 成功应用于该顶级研究,为关键实验验证提供稳定可靠支撑,再次印证 Absin 试剂的科研实力与国际认可度。
文献标题:MYC drives left-handed Z-DNA formation to shape gene expression
发表期刊:Nature Communications (IF=15.7)
DOI:https://doi.org/10.1038/s41467-025-66886-3
使用 Absin 产品:AO染色液(1mg/ml)(货号:abs9735)

一、研究核心问题与科学意义
常规 B?DNA 为右手螺旋,而Z?DNA是罕见左手螺旋构象,多富集于高转录区域,但其生理功能与调控机制长期不明。
MYC 作为经典癌蛋白,在多数肿瘤中异常激活,其是否通过改变 DNA 高级结构调控转录,是领域内关键科学问题。
本研究首次证实:
MYC→招募 FACT 复合物→重塑核小体 H2A/H2B 二聚体→诱导 Z?DNA 形成→促进 RNAP II 装载→全局激活转录
打破 “Z?DNA 只是转录副产物” 的传统认知,确立 Z?DNA 为主动转录调控元件,为肿瘤转录干预提供全新靶点。
二、核心研究思路与关键结果(图文对照原文)
1. MYC 以 FACT 依赖方式诱导 Z?DNA 形成(原文Fig.1)
在 U2OS、HeLa 等多细胞系过表达 MYC,细胞核内 Z?DNA 信号显著升高;
降解 MYC 可快速逆转 Z?DNA 升高,证明 MYC 直接驱动 Z?DNA 生成;
核酸酶处理显示:仅 DNase I 降低 Z?DNA 信号,证实为Z?DNA 而非 Z?RNA;
敲低 FACT 复合物(SSRP1/SPT16),MYC 无法诱导 Z?DNA,证明FACT 必需。
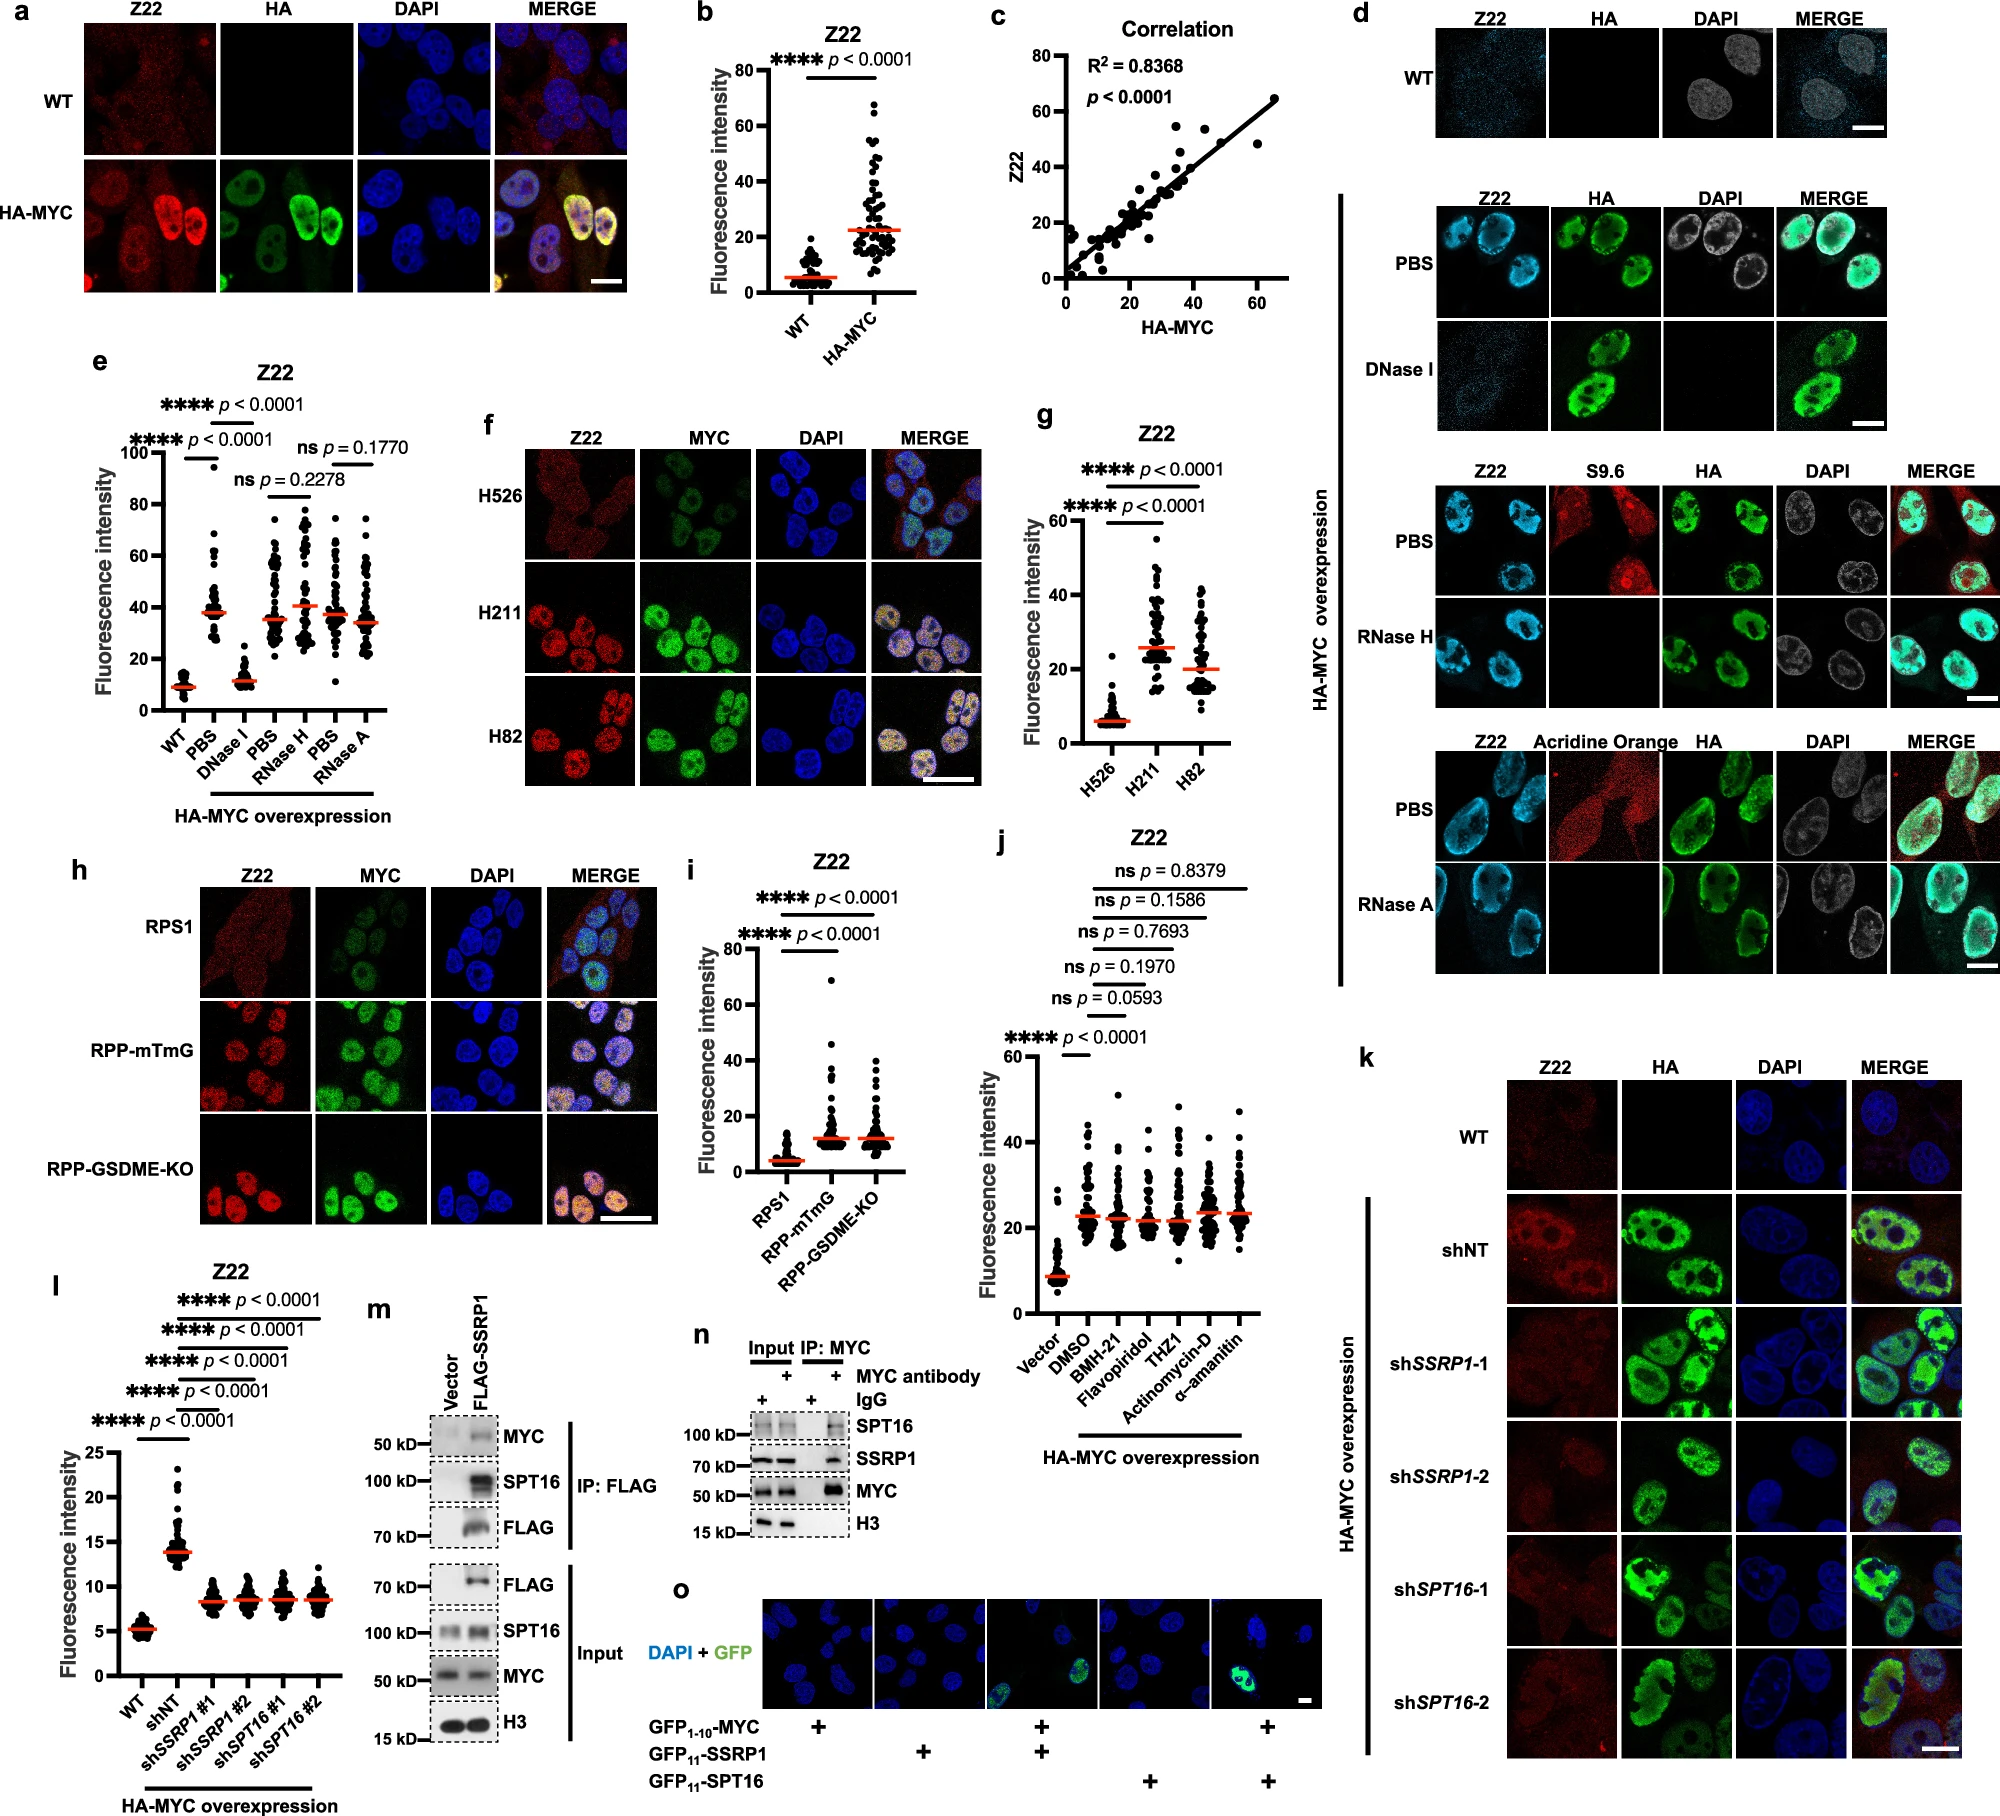
Fig. 1: MYC induces Z-DNA formation through the FACT complex.
a IF results showing the localization and expression levels of MYC and Z-NA. HA-tagged MYC was overexpressed in U2OS cells and stained with HA antibodies 3 days after transfection. Z-NA was detected using Z22 antibodies. Nuclei were stained with DAPI. Scale bar, 10?μm. b Z22 fluorescence intensity quantification results for each cell in (a). The data were represented by the scatter dots and mean values (WT, N?=?50 cells, HA-MYC, N?=?65 cells). p value was determined by unpaired two-sided t-test. The exact p values were indicated in the figure. Source data are provided as a Source Data file. c The correlation between HA-MYC and Z22 fluorescence intensity among each cell (N?=?50 cells) in (a). Data were analyzed using simple linear regression (two-sided test), with no adjustments for multiple comparisons. The exact p values were indicated in the figure. Source data are provided as a Source Data file. d IF results showing the Z-NA signals after treatment with various nucleases. U2OS cells expressing HA-MYC for 3 days were fixed, permeabilized, and then treated with 0.2?U/μL DNase I, 1?mg/mL RNase A, and 0.2?U/μL RNase H, respectively, at 37?°C for 3?h. The efficiencies of DNase I, RNase H, and RNase A treatments were verified by DAPI, S9.6, and Acridine Orange staining, respectively. Cells treated with PBS served as the negative control. Scale bar, 10?μm. e Z22 fluorescence intensity quantification results of each cell in (d). The data were represented by the scatter dots and mean values (WT, N?=?51 cells; PBS control for DNAse I treatment, N?=?52 cells; DNAse I, N?=?52 cells; PBS control for RNAseH treatment, N?=?64 cells; RNAseH, N?=?54 cells; PBS control for RNAseA treatment, N?=?64 cells; RNAseA, N?=?63 cells). p value was determined by unpaired two-sided t-test. The exact p values were indicated in the figure. Source data are provided as a Source Data file. f IF results showing the MYC and Z-NA signals in H526 (low MYC expression), H211 and H82 cells (high MYC expression) of human SCLC lines. Scale bar, 10?μm. g Z22 fluorescence intensity quantification results for each cell in (f). The data were represented by the scatter dots and mean values (H526, N?=?53 cells; H211, N?=?52 cells; H82, N?=?53 cells). p value was determined by unpaired two-sided t-test. The exact p values were indicated in the figure. Source data are provided as a Source Data file. h IF results showing the MYC and Z-NA signals in RPS1 (low MYC expression), RPP-mTmG and RPP-GSDME-KO cells (high MYC expression) of mouse SCLC lines. Scale bar, 10?μm. i Z22 fluorescence intensity quantification results for each cell in (h). The data were represented by the scatter dots and mean values (RPS1, N?=?53 cells; RPP-mTmG, N?=?55 cells; RPP-GSDME-KO, N?=?55 cells). p value was determined by unpaired two-sided t-test. The exact p values were indicated in the figure. Source data are provided as a Source Data file. j Z22 fluorescence intensity quantification results of U2OS cells treated with different RNAP II inhibitors. Cells expressing HA-tagged MYC were treated with 1?μM BMH?21, 1?μM Flavopiridol, 1?μM THZ1, 1?μg/mL Actinomycin-D, and 10?μg/μL α-amanitin for 6?h. The data were represented by the scatter dots and mean values (Vector, N?=?61 cells; DMSO, N?=?57 cells; BMH-21, N?=?69 cells; Flavopiridol, N?=?52 cells; THZ1, N?=?67 cells; Actinomycin-D, N?=?74 cells; α–amanitin, N?=?68 cells). p value was determined by unpaired two-sided t-test. The exact p values were indicated in the figure. Source data are provided as a Source Data file. k IF results showing the Z-DNA signals in HA-MYC overexpressing cells 3 days after SSRP1 or SPT16 depletion. NT non-target control. Scale bar, 10?μm. l Z22 fluorescence intensity quantification results for each cell in (k). The data were represented by the scatter dots and mean values (WT, N?=?59 cells; shNT shSSRP1-1, N?=?69 cells; shSSRP1-2, N?=?60 cells; shSPT16-1, N?=?60 cells; shSPT16-2, N?=?61 cells). pvalue was determined by unpaired two-sided t-test. The exact p values were indicated in the figure. Source data are provided as a Source Data file. m SSRP1 bound with MYC and SPT16. FLAG-tagged SSRP1 was purified by FLAG beads in HEK293T cells. Proteins from input and IP samples were analyzed by Western blotting using the indicated antibodies. The assay was performed in three independent biological replicates with similar results. Source data are provided as a Source Data file. n Endogenous MYC bound with SSRP1 and SPT16. MYC antibody was used to pull down endogenous MYC and bound FACT proteins in HEK293T cells. Proteins from input and IP samples were analyzed by Western blotting using the indicated antibodies. The assay was performed in three independent biological replicates with similar results. Source data are provided as a Source Data file. o IF results showing DAPI and GFP merged signals after GFP1-10-tagged MYC and GFP11-tagged SSRP1 or SPT16 were expressed in U2OS cells together or respectively. Scale bar, 10?μm. The assay was performed in three independent biological replicates with similar results.
2. FACT 通过重塑 H2A/H2B 二聚体促进 Z?DNA(原文Fig.2)
体外 EMSA 显示 FACT 结合核小体并诱导 Z?DNA;
缺失与 H2A/H2B 结合结构域的 FACT 突变体,完全丧失诱导 Z?DNA 能力;
仅 H3/H4 四聚体无 H2A/H2B 时,FACT 无法形成 Z?DNA,明确H2A/H2B 为必要条件。
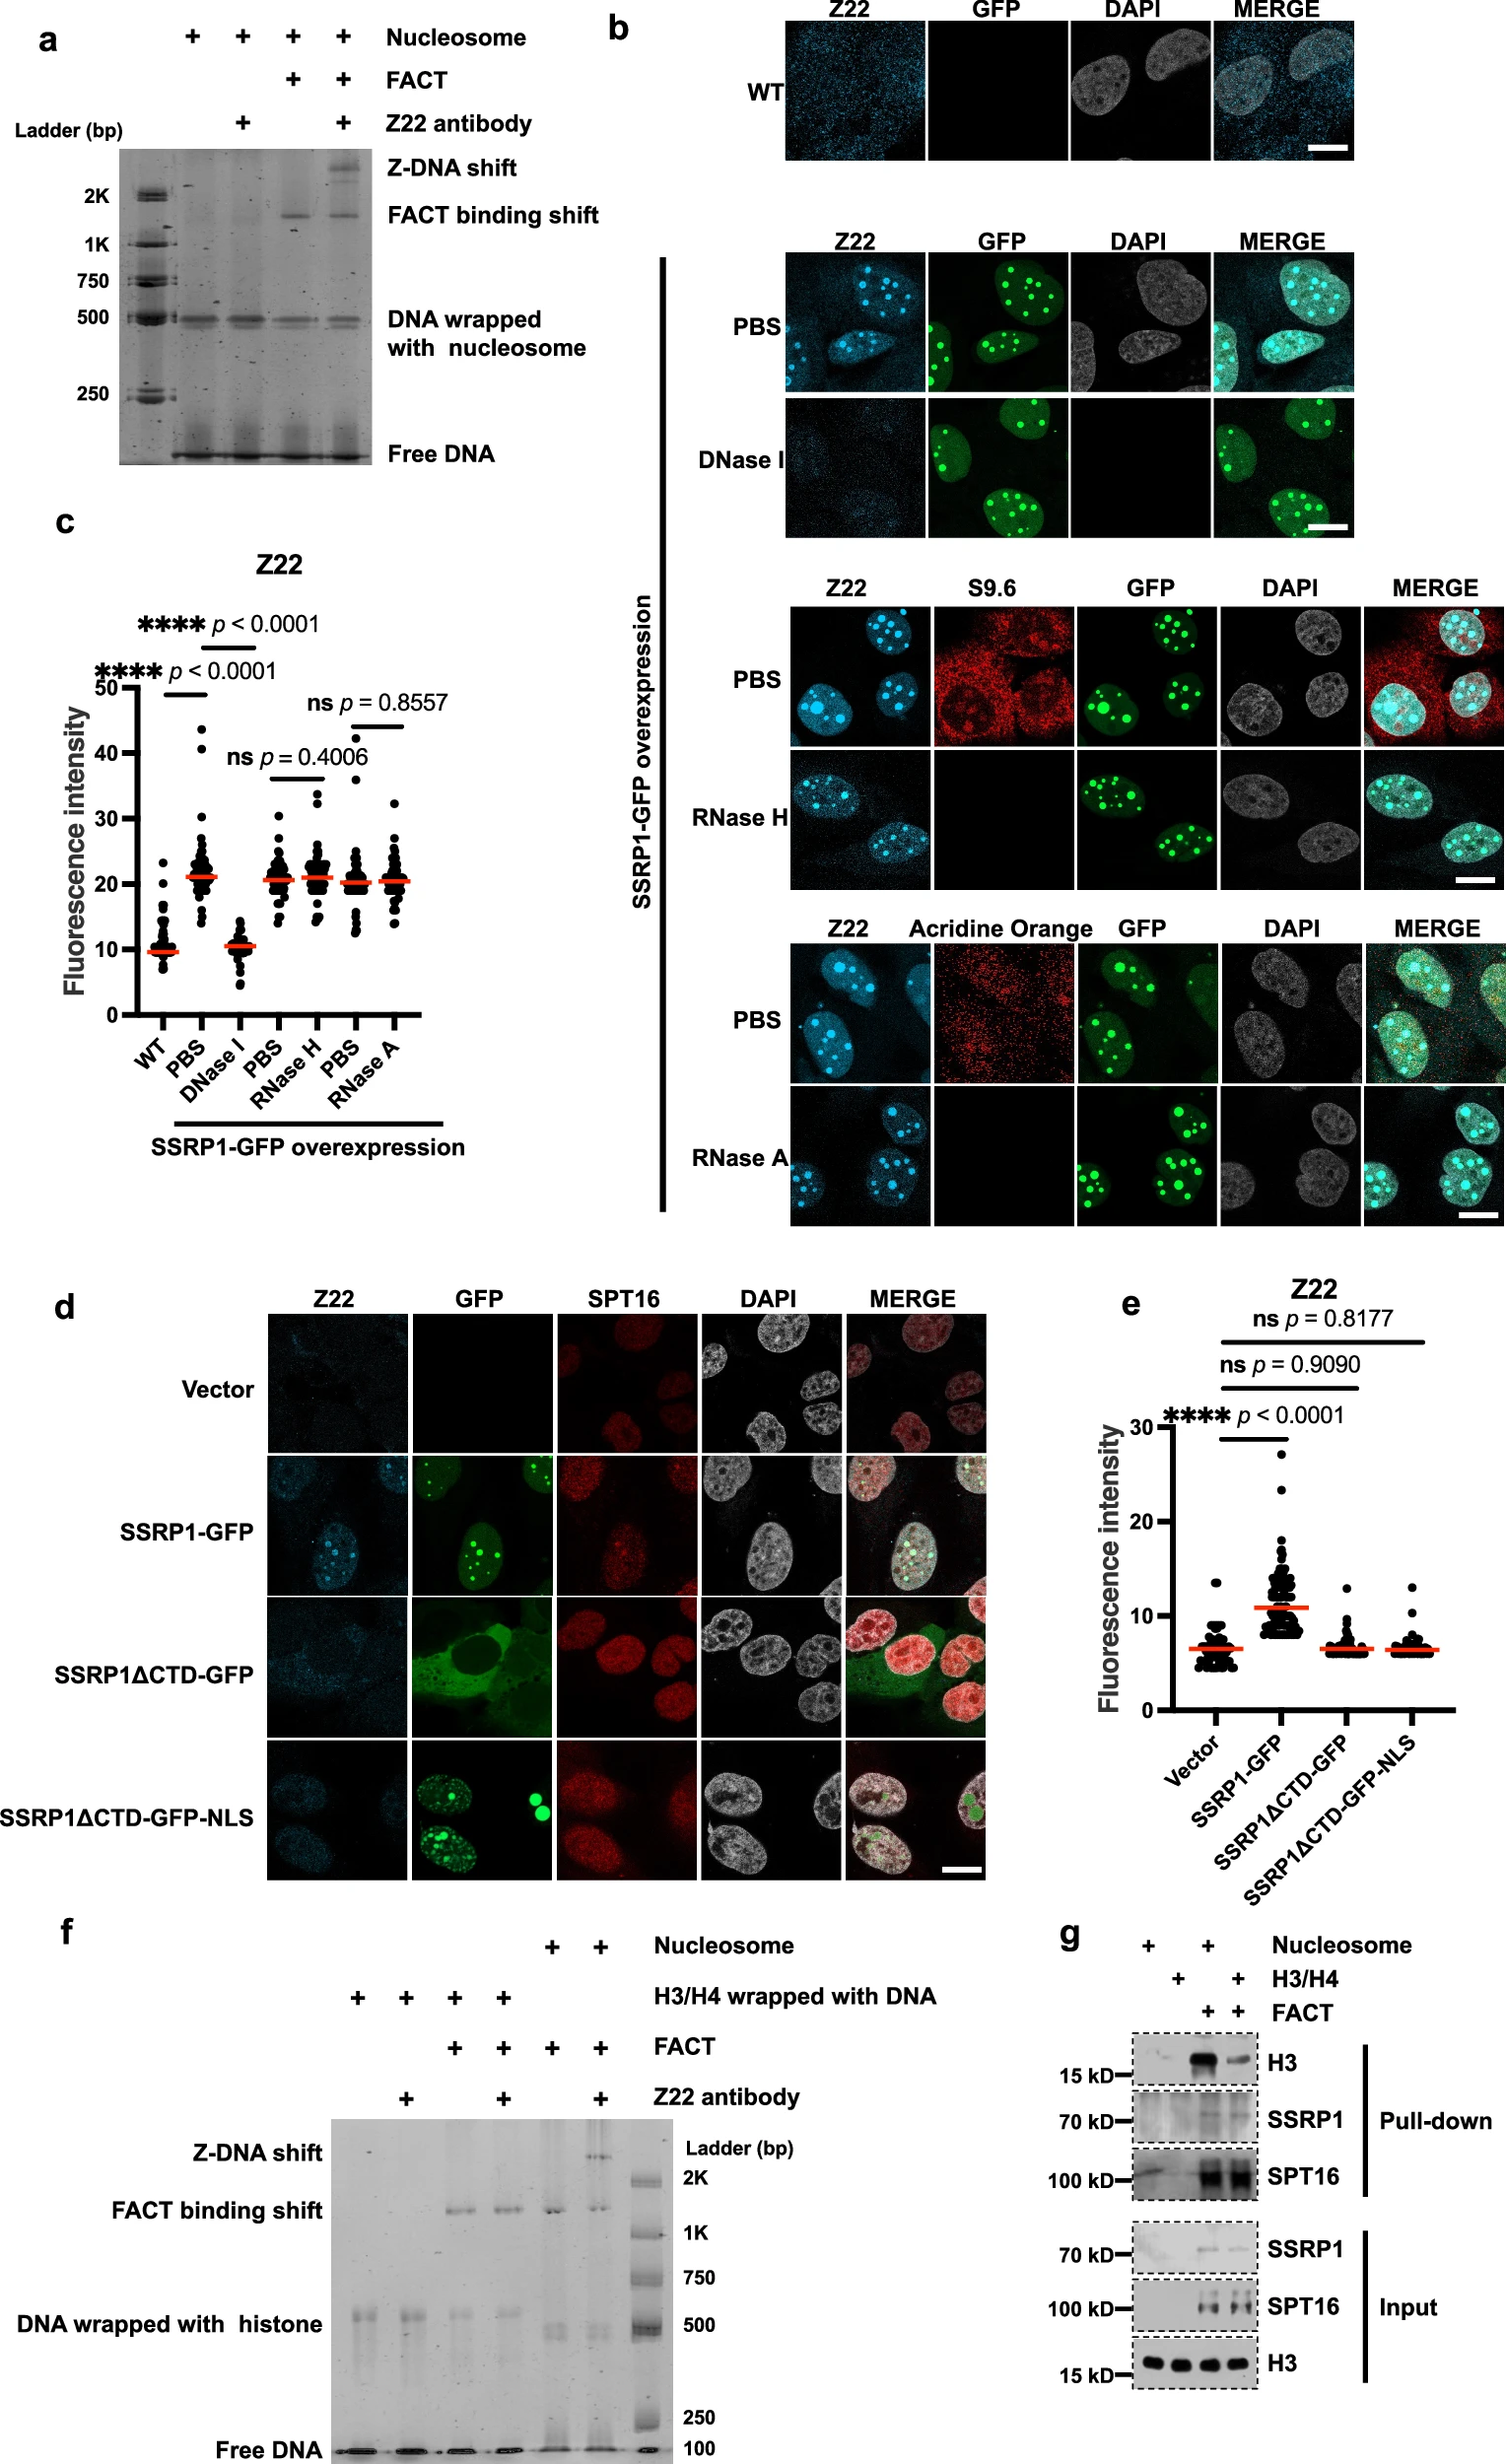
Fig. 2: FACT complex induces Z-DNA formation through the binding with H2A/H2B.
a EMSA assay showing the formation of Z-DNA by FACT. Nucleosomes, FACT, and Z22 antibody were incubated at molar ratios of 3:1:1 (nucleosome:FACT:Z22) in 20?μL of reaction buffer (10?mM HEPES pH 7.5 and 10?mM MgCl2). A 6% Native-PAGE gel was stained with GelRed to show the gel shifting of DNA by FACT and Z22 antibody. The assay was performed in three independent biological replicates with similar results. b IF results showing the localization and expression level of SSRP1-GFP and Z-NA after treatment with various nucleases. U2OS cells expressing SSRP1-GFP for 3 days were fixed, permeabilized, and then treated with 0.2?U/μL DNase I, 1?mg/mL RNase A, and 0.2?U/μL RNase H, respectively, at 37?°C for 3?h. The efficiencies of DNase I, RNase H, and RNase A treatments were verified by DAPI, S9.6, and Acridine Orange staining, respectively. Cells treated with PBS served as a negative control. Scale bar, 10?μm. c Z22 fluorescence intensity quantification results of each cell in (b). The data were represented by the scatter dots and mean values (WT, N?=?56 cells; PBS control for DNAse I treatment, N?=?62 cells; DNAse I, N?=?61 cells; PBS control for RNAseH treatment, N?=?60 cells; RNAseH, N?=?60 cells; PBS control for RNAseA treatment, N?=?60 cells; RNAseA, N?=?60 cells). p value was determined by unpaired two-sided t-test. The exact p values were indicated in the figure. Source data are provided as a Source Data file. d IF results showing the localization and expression level of WT and mutant SSRP1-GFP, endogenous SPT16, and Z-DNA. GFP-tagged SSRP1 and mutants were transfected into U2OS cells for 3 days. NLS, nuclear localization signal. Scale bar, 10?μm. e Z22 fluorescence intensity quantification results for each cell in (d). The data were represented by the scatter dots and mean values (Vector, N?=?62 cells; SSRP1-GFP, N?=?102 cells; SSRP1ΔCTD-GFP, N?=?79 cells; SSRP1ΔCTD-GFP-NLS, N?=?60 cells). p value was determined by unpaired two-sided t-test. The exact p values were indicated in the figure. Source data are provided as a Source Data file. f EMSA assay showing the formation of Z-DNA by nucleosome or H3/H4 wrapped with DNA. Nucleosomes or H3/H4 wrapped with DNA, FACT, and Z22 antibody were incubated at molar ratios of 3:1:1 (nucleosome:FACT:Z22) in 20?μL of reaction buffer (10?mM HEPES pH 7.5 and 10?mM MgCl2). A 6% Native-PAGE gel was stained with GelRed to show the gel shifting of DNA by FACT and Z22 antibody. The assay was performed in three independent biological replicates with similar results. g In vitro pull-down results showing the binding between FACT and the indicated substrates. SSRP1 antibody was used to pull down FACT and histones. The assay was performed in three independent biological replicates with similar results. Source data are provided as a Source Data file.
3. CK2?PP2AC 轴磷酸化调控 FACT 相分离(原文Fig.3)
FACT 通过液?液相分离(LLPS)形成核内凝聚体;
CK2 磷酸化 SSRP1?S510 促进相分离,PP2AC 去磷酸化逆转;
磷酸化不影响 FACT 结合核小体,但显著增强 MYC 对 FACT 的招募效率。
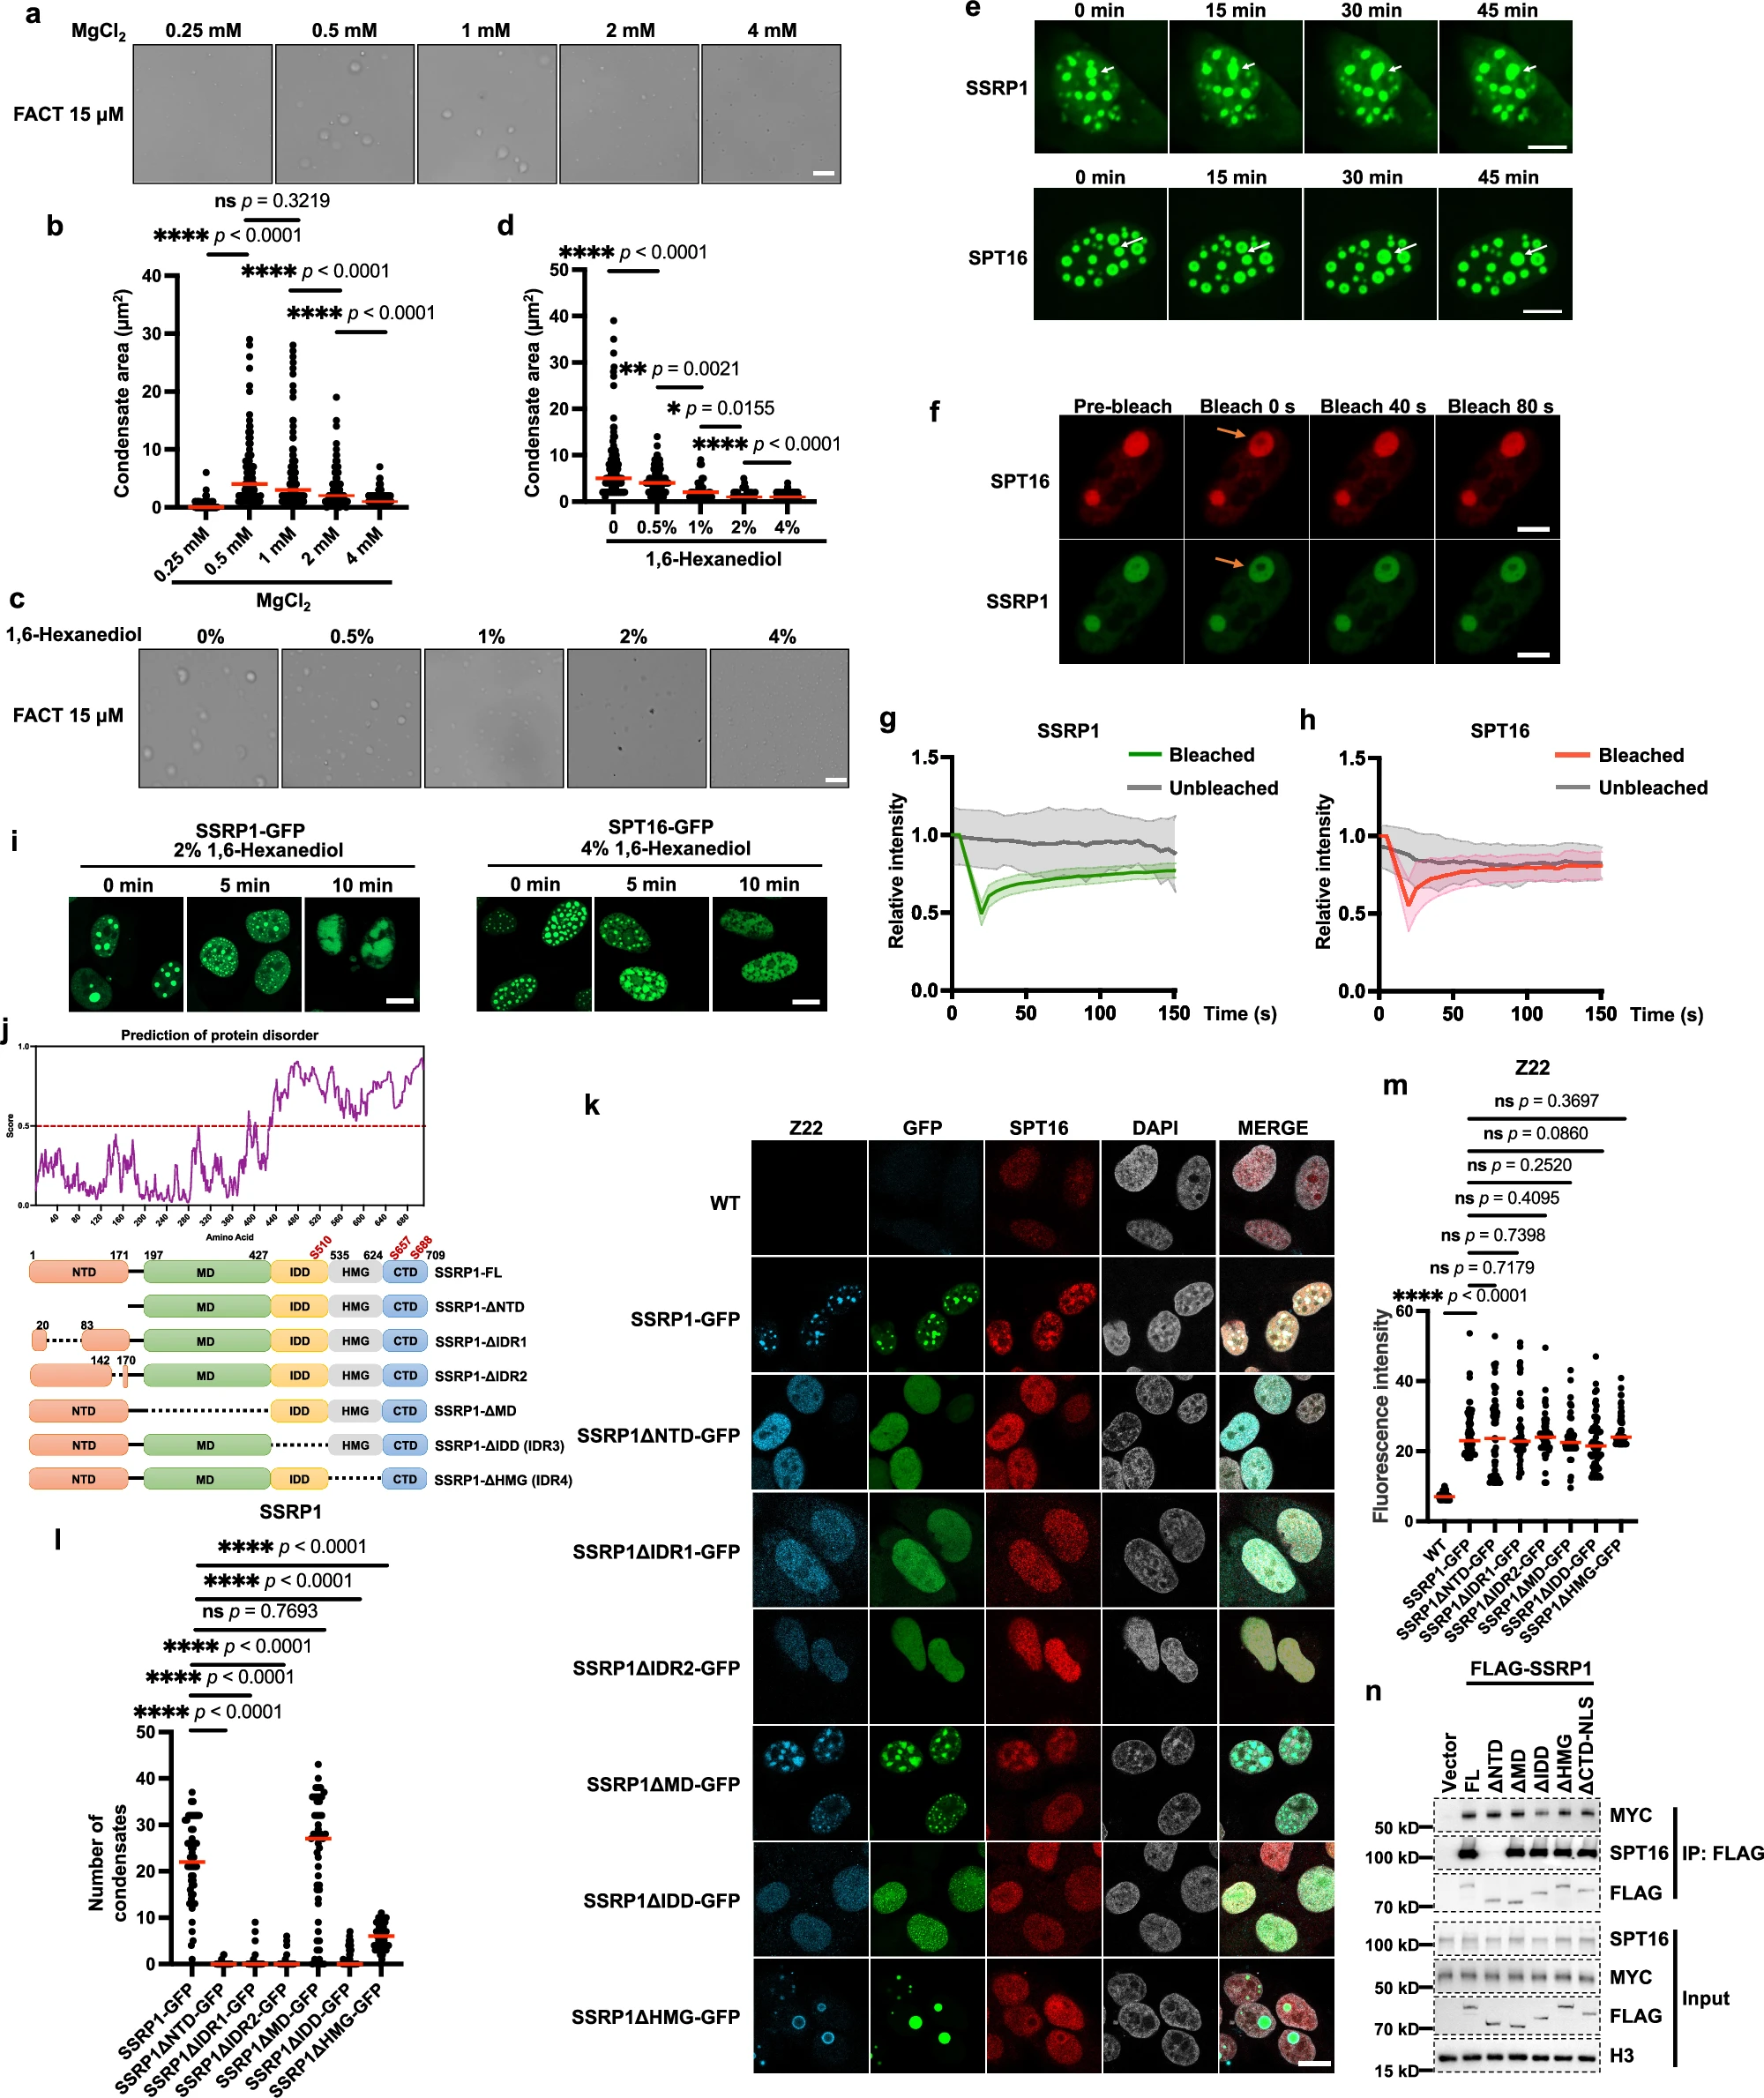
Fig. 3: FACT complex performs phase separation in vivo and in vitro.
a Microscopy results showing the FACT condensates in different concentrations of MgCl2. FACT (15?μM) mixed with MgCl2 at different concentrations (0.25, 0.5, 1, 2, and 4?mM from left to right) was analyzed for the formation of droplets at 75?mM NaCl and 25?mM Tris-HCl pH 7.5. Scale bar, 10?μm. The assay was performed in three independent biological replicates with similar results. bCondensate area quantification results of each droplet in (a). The data were represented by the scatter dots and mean values (0.25?mM, N?=?140 droplets; 0.5?mM, N?=?180 droplets; 1?mM, N?=?187 droplets; 2?mM, N?=?178 droplets; 4?mM, N?=?149 droplets). p value was determined by unpaired two-sided t-test. The exact p values were indicated in the figure. Source data are provided as a Source Data file. c Microscopy results showing the FACT condensates treated with 1,6-Hexanediol. FACT (15?μM) mixed with 1,6-Hexanediol at different concentrations (0, 0.5%, 1%, 2%, and 4% from left to right) was analyzed for the formation of droplets at 0.5?mM MgCl2, 75?mM NaCl, and 25?mM Tris-HCl pH 7.5. Scale bar, 10?μm. The assay was performed in three independent biological replicates with similar results. d Condensate area quantification results for each droplet in (c). The data were represented by the scatter dots and mean values (0, N?=?130 droplets; 0.5%, N?=?124 droplets; 1%, N?=?29 droplets; 2%, N?=?31 droplets; 4%, N?=?243 droplets). p value was determined by unpaired two-sided t-test. The exact p values were indicated in the figure. Source data are provided as a Source Data file. e Fluorescence results of live U2OS cells transfected with SSRP1-GFP and SPT16-GFP. The live cell imaging was conducted 72?h following the transfection of U2OS cells with SSRP1-GFP or SPT16-GFP. Representative images showing a condensate at different time points. Scale bar, 10?μm. Arrows indicate the merging sites. The assay was performed in three independent biological replicates with similar results. f FRAP assay of U2OS cells transfected with SPT16-mCherry and SSRP1-GFP together. Representative images showing a condensate before and at different time points after photobleaching. Scale bar, 10?μm. Arrows indicate the photobleaching sites. Relative intensity quantification of SSRP1-GFP (g) and SPT16-mCherry (h) in representative bleached and unbleached droplets. The data were represented by the mean?±?SD (N?=?3 independent replicates). Source data are provided as a Source Data file. i Microscopy results showing the SSRP1 condensates treated with 2% 1,6-Hexanediol and SPT16 condensates treated with 4% 1,6-Hexanediol at the indicated time points in U2OS cells. Scale bar, 10?μm. The assay was performed in three independent biological replicates with similar results. j The disordered regions of SSRP1 predicted by NovoPro (upper panel) and the illustration showing the protein domains of SSRP1 (lower panel). Source data are provided as a Source Data file. k IF results showing the localization and expression levels of WT and mutant SSRP1-GFP, endogenous SPT16, and Z-NA in U2OS cells. Scale bar, 10?μm. l Condensate number quantification results for each cell in (k). The data were represented by the scatter dots and mean values (SSRP1-GFP, N?=?50 cells; SSRP1ΔNTD-GFP, N?=?55 cells; SSRP1ΔIDR1-GFP, N?=?52 cells; SSRP1ΔIDR2-GFP, N?=?49 cells; SSRP1ΔMD-GFP, N?=?50 cells; SSRP1ΔIDD-GFP, N?=?52 cells; SSRP1ΔHMG-GFP, N?=?51 cells). p value was determined by unpaired two-sided t-test. The exact pvalues were indicated in the figure. Source data are provided as a Source Data file. m Z22 fluorescence intensity quantification results for each cell in (k). The data were represented by the scatter dots and mean values (WT, N?=?58 cells; SSRP1-GFP, N?=?59 cells; SSRP1ΔNTD-GFP, N?=?56 cells; SSRP1ΔIDR1-GFP, N?=?56 cells; SSRP1ΔIDR2-GFP, N?=?56 cells; SSRP1ΔMD-GFP, N?=?54 cells; SSRP1ΔIDD-GFP, N?=?55 cells; SSRP1ΔHMG-GFP, N?=?54 cells). p value was determined by unpaired two-sided t-test. The exact p values were indicated in the figure. Source data are provided as a Source Data file. n The deletions of IDD and NTD domains of SSRP1 disrupted the binding of SSRP1 with MYC and SPT16, respectively. FLAG-tagged WT SSRP1 and mutants were purified by FLAG beads in HEK293T cells. Proteins from input and IP samples were analyzed by Western blotting using the indicated antibodies. The assay was performed in two independent biological replicates with similar results. Source data are provided as a Source Data file.
4. Z?DNA 直接促进 RNAP II 装载与基因表达(原文Fig.6)
全基因组分析显示:Z?DNA 峰值与 RNAP II 富集高度正相关;
工程化 Z?DNA 启动子(Z?SCPs)直接证明:Z?DNA 结构本身即可提升转录;
ADAR1 的 Z?DNA 结合域可清除 Z?DNA,进而抑制 RNAP II 装载与转录激活。
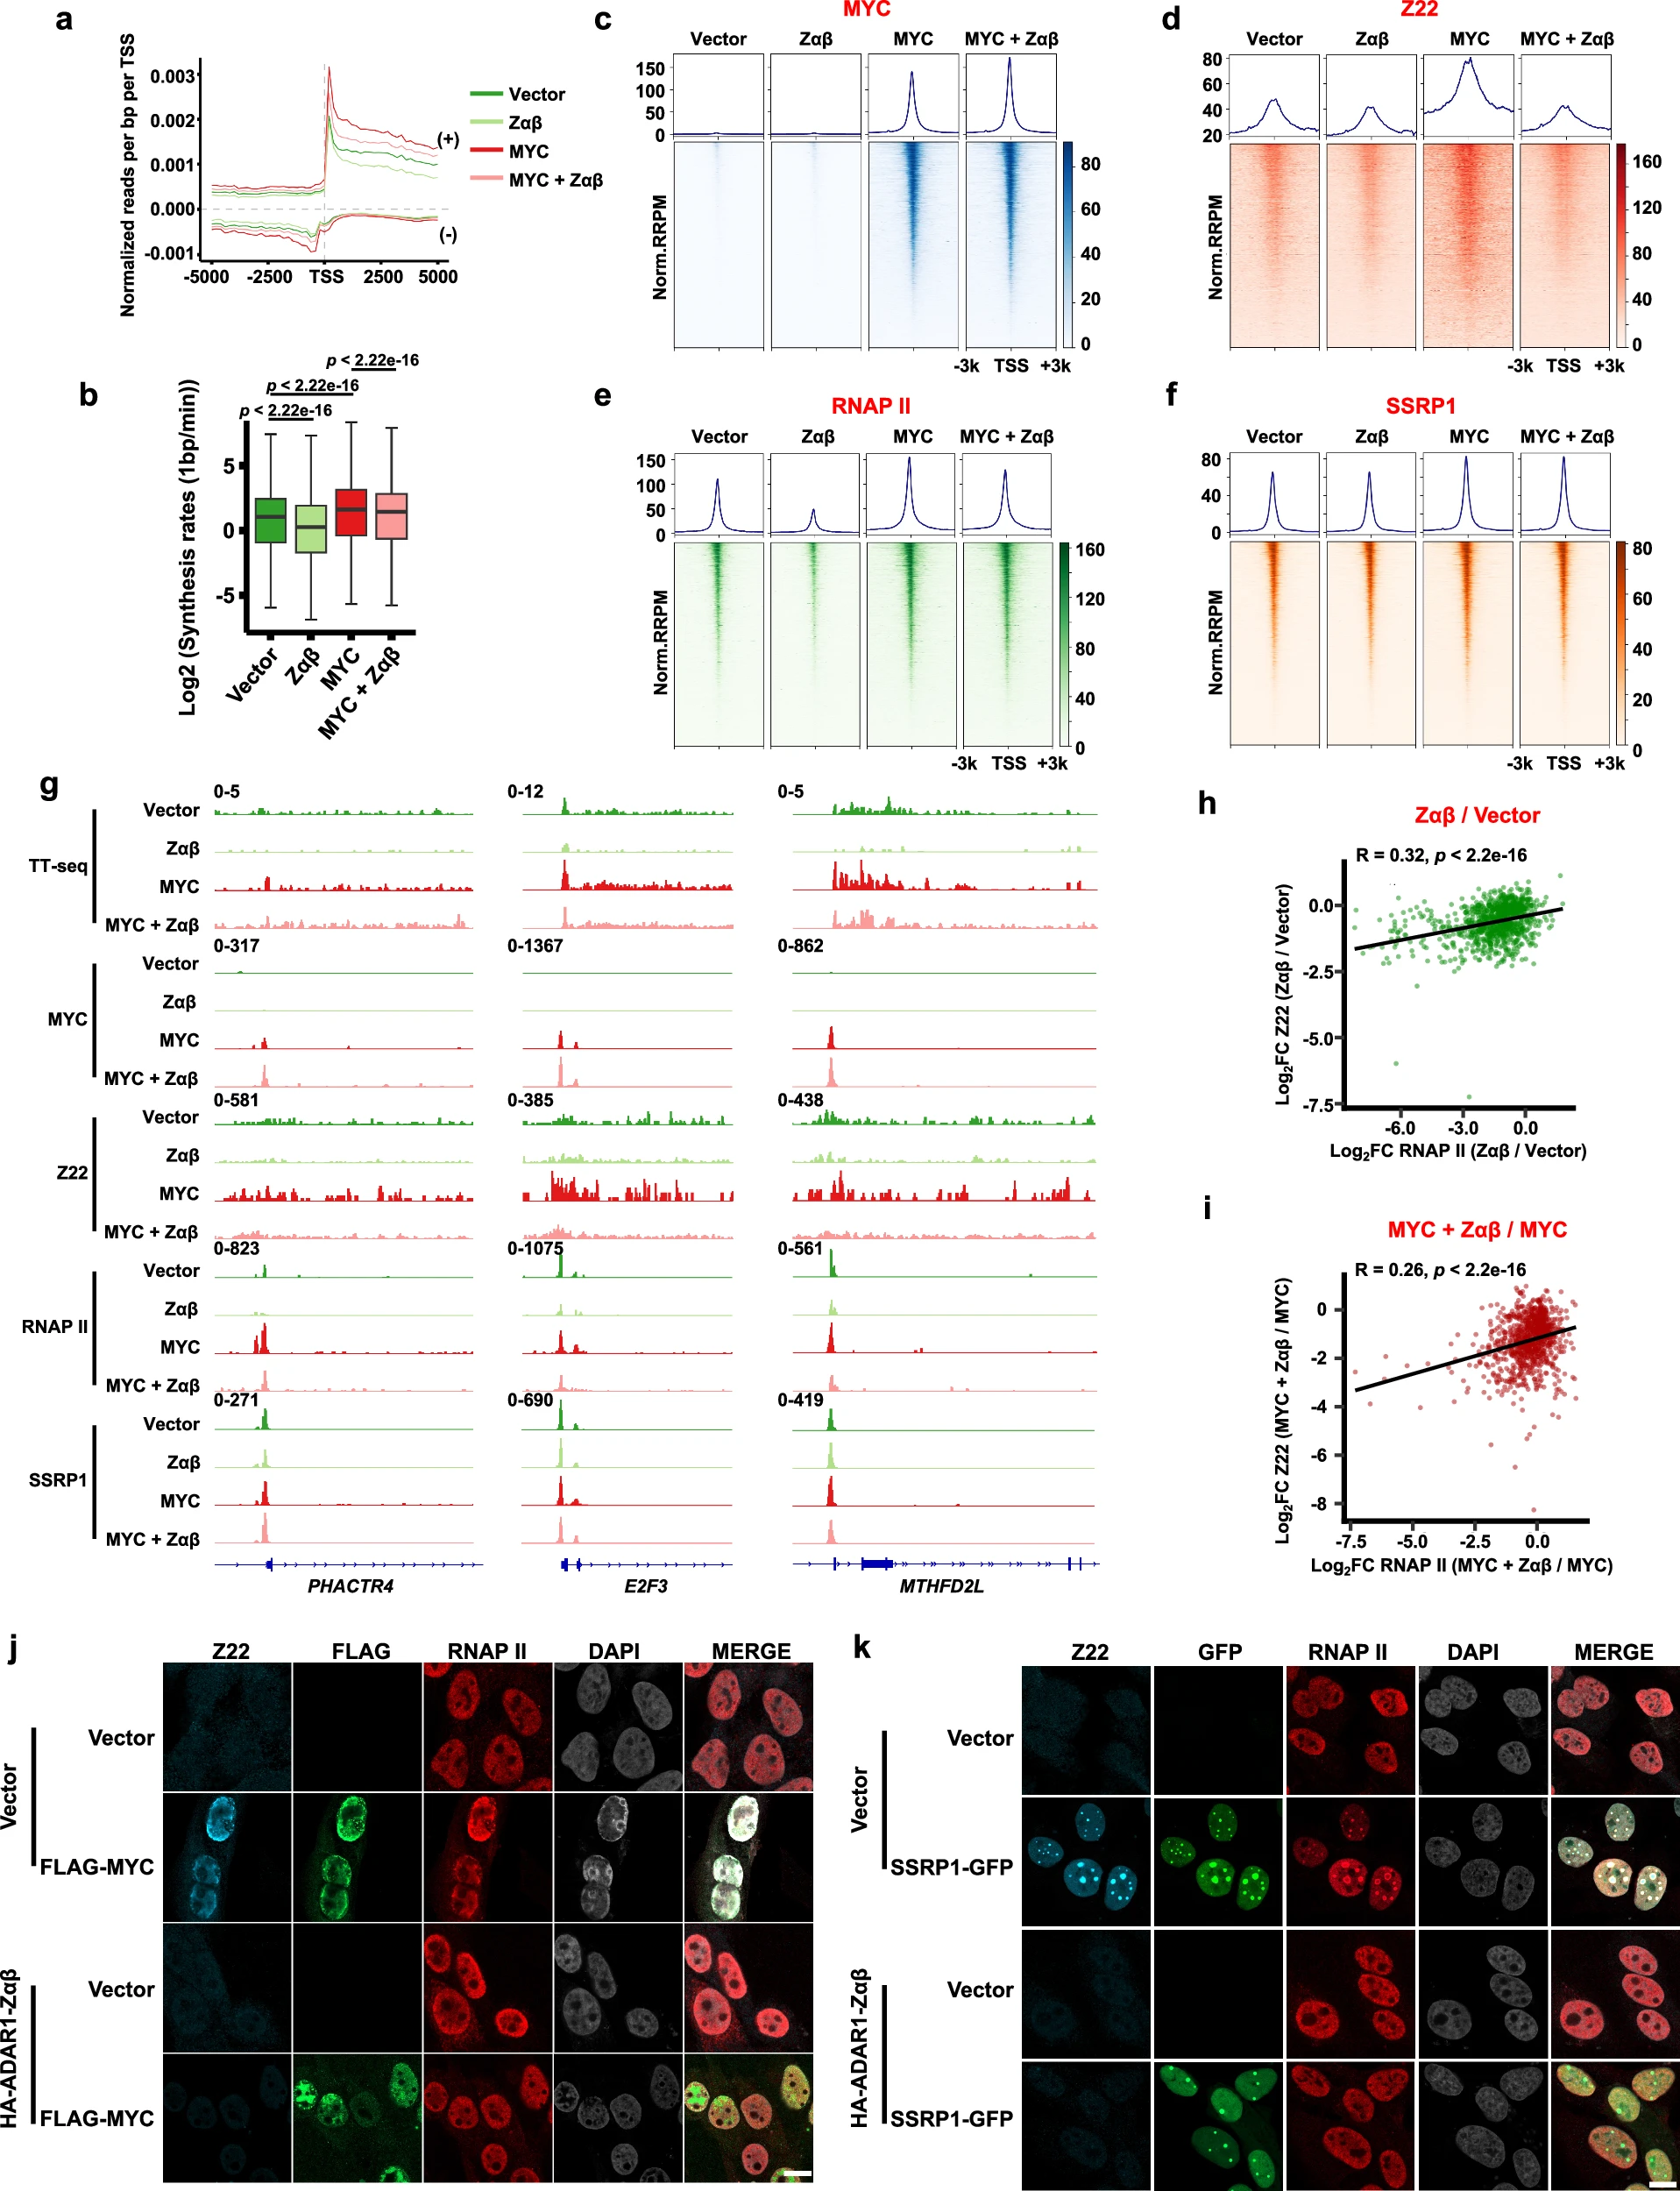
Fig. 6: MYC-induced Z-DNA formation recruits RNAP II to regulate gene expression.
a The normalized distribution profiles of TT-seq signals spanning 5?kb around TSS showing the average levels in Vector, ADAR1-Zαβ overexpressing, MYC overexpressing, and MYC?+?ADAR1-Zαβ overexpressing U2OS cells. Sense (+) and antisense (?) transcripts associated with NCBI RefSeq TSS were shown. b Boxplots showing the synthesis rates. The p values were calculated by a two-sided unpaired Wilcoxon rank-sum test. Centerline, median; box limits, upper and lower quartiles; whiskers, 1.5x interquartile range. Vector, N?=?13,464 genes, Zαβ, N?=?13,016 genes, MYC, N?=?13,256 genes, MYC?+?Zαβ, N?=?13,931 genes. The exact p values were indicated in the figure. Source data are provided as a Source Data file. The normalized distribution of MYC (c), Z22 (d), RNAP II (e), and SSRP1 (f) levels spanning 3?kb around the TSS of genes identified by NCBI RefSeq. The distribution profiles were presented at the top, while the heatmaps were displayed below. MYC, RNAP II, and SSRP1 distributions were detected using CUT&Tag with corresponding antibodies. Z-DNA was detected by Z22 antibodies using ChIP-seq. RRPM reference-adjusted reads per million. g Integrative Genomics Viewer (IGV) tracks presenting TT-seq signals and the enrichment of MYC, Z-DNA, RNAP II, and SSRP1. h Correlations between changes in RNAP II and Z-DNA. Signals were analyzed at RNAP II peaks identified in Vector U2OS cells. FC fold-change. R, the correlation coefficient, was assessed by Pearson product-moment correlation. The p value was calculated by a two-sided paired t-test. The exact p value was indicated in the figure. Source data are provided as a Source Data file. i Same as in (h), except for changes at RNAP II peaks identified in MYC overexpressing U2OS cells. The p value was calculated by a two-sided paired t-test. The exact p value was indicated in the figure. Source data are provided as a Source Data file. j IF results showing the localization and expression levels of FLAG-MYC, RNAP II, and Z-DNA after MYC and ADAR1-Zαβ expression in U2OS cells. FLAG-tagged MYC and HA-tagged ADAR1-Zαβ were overexpressed in U2OS cells. Empty vectors were used as negative controls. Scale bar, 10?μm. The assay was performed in three independent biological replicates with similar results. k IF results showing the localization and expression levels of SSRP1-GFP, RNAP II, and Z-DNA after SSRP1 and ADAR1-Zαβ expression in U2OS cells. GFP-tagged SSRP1 and HA-tagged ADAR1-Zαβ were overexpressed in U2OS cells. Empty vectors were used as negative controls. Scale bar, 10?μm. The assay was performed in three independent biological replicates with similar results.
三、Absin abs9735 在研究中的关键作用(精准对应实验场景)
? 产品信息
| 产品名称 | 吖啶橙染色液(Acridine Orange, AO) |
| 货号 | abs9735 |
| 核心特性 | 膜通透型荧光染料,双链 DNA 发绿色荧光,单链 DNA/RNA 发红色荧光,可快速区分核酸类型与定位。 |
? 本研究中的精准应用
在核酸酶处理验证 Z?DNA 来源的关键对照实验中(原文Fig.1d/e方法部分):
研究用 DNase I、RNase A、RNase H 分别处理 MYC 过表达细胞;
使用Absin abs9735(5 μg/mL) 室温染色 10 min;
通过红绿荧光差异验证 RNase A/RNase H 酶解完全,确保 Z?信号确由 DNA 产生。
? 不可替代的科研价值
高特异性:精准区分 DNA/RNA,为 “MYC 诱导 Z?DNA 而非 Z?RNA” 提供直接视觉证据;
高灵敏度:微量核酸即可清晰成像,支持单细胞水平定量统计;
稳定可靠:批间差小、染色均一,适配荧光显微镜成像与量化分析,支撑顶刊数据严谨性。
四、研究总结与 Absin 使命
本研究以完整证据链揭示MYC?FACT?Z?DNA?RNAP II调控轴,将 DNA 构象、染色质重塑、相分离与转录调控完美串联,是表观遗传与肿瘤机制领域的里程碑工作。
Absin abs9735 以稳定优异表现,成为顶级研究中核酸对照验证的关键工具,彰显国产生物试剂比肩国际品质的实力。
未来,Absin 将持续聚焦生命科学前沿需求,提供更多高灵敏、高稳定、高性价比试剂产品,助力中国科研成果持续登顶国际顶级期刊,为全球生命科学突破贡献力量!

- 手机:13761418683