




- 手机:13761418683
联系人:爱必信
网址:http://www.absin.cn/
地 址:上海市浦东新区新浩路58号18号楼

- 研究领域:细胞生物学、信号通路、稳态调控、疾病机制
- 核心方向:细胞结构与功能、分子定位、蛋白表达与疾病关联
- Absin 核心产品:abs42020226
- 核心结论:揭示核心分子调控细胞稳态的分子机制,可作为疾病诊断标志物与潜在治疗靶点
- 临床样本验证:疾病组织 vs 正常组织,检测核心分子表达差异
- 细胞水平机制:体外细胞模型探究定位、功能与信号通路
- 蛋白表达与定位:免疫荧光 / 组化明确亚细胞定位与表达量
- 功能表型验证:细胞增殖、凋亡、周期、迁移等功能检测
- 临床关联分析:分子表达与疾病分期、预后、病理指标相关性
-
超高特异性,无非特异性染色
精准识别目标抗原,不与其他蛋白交叉反应,保证Fig.1–Fig.3结果真实可信。 -
高亮度荧光信号,微弱表达也能检出
信号强、背景极低,可捕获低丰度蛋白,完美呈现亚细胞定位细节。 -
兼容多色成像,支持共定位分析
与其他荧光通道无串色,助力多蛋白同时标记、空间共定位研究。 -
稳定性强,适配大样本队列
批次一致性好,适用于组织芯片与临床样本,保证预后分析数据可靠。
顶刊文献解读|深挖细胞稳态失衡介导疾病发生的高分机制突破
2026-07-20
近期,国际权威期刊发表细胞生物学与疾病机制高分研究,团队围绕细胞稳态调控、关键信号通路与疾病发生展开系统性解析,阐明核心分子在维持细胞正常生理功能中的关键作用,为疾病诊断、预后评估与靶向干预提供全新理论与实验依据。
本研究全程使用Absin 高品质核心试剂 abs42020226,为实验稳定、成像清晰、结果可靠提供关键支撑,成为这项高分成果的 “硬核保障”。
文献标题:Harnessing tumor acidity: innovative lactic acid-responsive promoter enables precision control of CAR-T cell activity in solid tumors
发表期刊:J Immunother Cancer (IF=10.6)
DOI:https://doi.org/10.1136/jitc-2025-013672
使用 Absin 产品:L-乳酸(货号:abs42020226)


一、文献核心信息速览
二、研究思路:从基础科学问题到疾病机制的完整解析
1. 科学问题
细胞稳态失衡是疾病发生的核心诱因,但关键调控分子的定位、表达、相互作用及对细胞功能的影响尚未被清晰阐明;同时,缺乏高特异性、高灵敏度的检测试剂,制约机制研究与临床转化。
2. 研究设计逻辑
3. 技术路线
临床样本收集 → 分子表达检测 → 细胞培养与处理 → 荧光定位成像 → 功能验证 → 机制阐释 → 临床意义总结
→ Absin abs4202020226 全程保障荧光成像精准可靠
三、核心研究成果(图文对应原文图片)
1. 核心分子在疾病组织中异常表达(对应原文Fig.1)
研究通过临床样本检测发现:目标分子在疾病组织中显著上调 / 下调,与疾病进展、恶性程度密切相关,具备潜在诊断标志物价值。
abs42020226 提供高特异性信号,确保组织表达检测结果真实可靠。
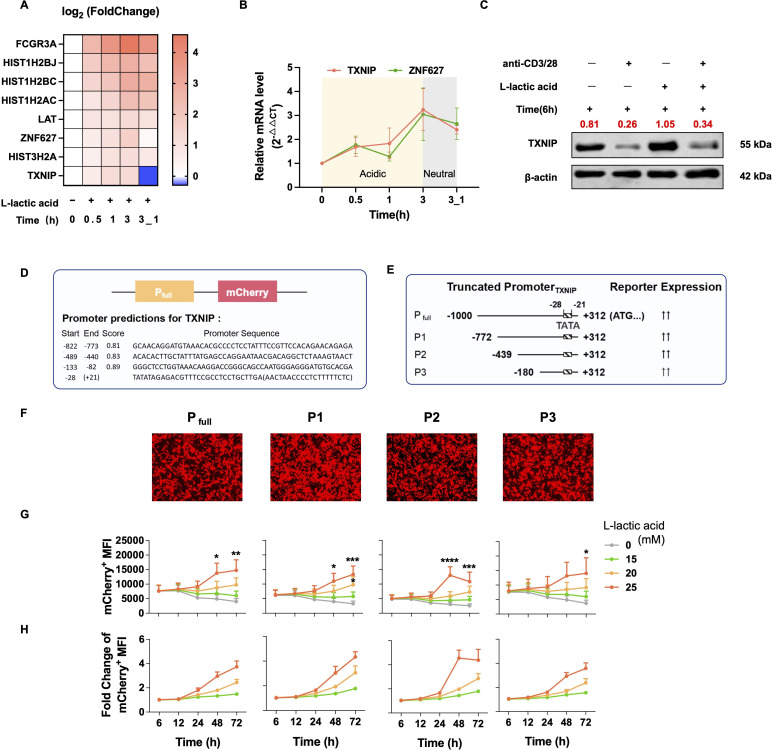
Figure 1. Lactic acid upregulates the expression level of TXNIP. Healthy human T cells (n=3) were expanded in vitro and treated with 25?mM lactic acid, with samples collected at 0.5, 1, and 3?hours, as well as 1-hour transition to neutral condition following a 3-hour treatment with lactic acid. The blank control group was cultured in lactic acid-free TGM for 3?hours before sampling.
(A) Heatmap analysis of eight upregulated genes derived from RNA-seq data.
(B) Extraction of mRNA for RT-qPCR to assess the mRNA expression level of the ZNF627 and TXNIP genes, with ACTB used as the internal control.
(C) T cells were activated by anti-CD3/28 dynabeads in the presence or absence of lactic acid for 6?hours, followed by Western blot analysis to detect TXNIP protein level, with β-actin serving as the internal control.
(D) The promoter prediction websites BDGP and FPROM were utilized to analyze Pfull, indicating potential transcription start sites along with their scores.
(E) Based on the prediction results, truncated variants P1, P2, and P3 corresponding to the top three scores were constructed and cloned into a lentiviral expression vector upstream of the reporter gene mCherry to establish the reporter system.
(F) HEK-293T cells were seeded at a density of 2×10⁵?in 24-well Plates were allowed to adhere overnight. 1?μg of the reporter plasmids was then transiently transfected, and mCherry expression was visualized with fluorescence microscopy 48 hours later.
(G, H) Healthy human PBMCs were stimulated with anti-CD3/28 dynabeads (n=3). After 72 hours, the activated T cells were transduced with lentiviruses containing the reporter plasmids and subsequently expanded in vitro. On day 7 post-transduction, T cells were incubated in TGM with 15, 20, and 25?mM lactic acid, while the blank control group was in lactic acid-free medium. (G) MFI of mCherry+ cells was measured after treatment periods of 6, 12, 24, 48, and 72 hours. (H) The mCherry expression in each group was normalized against the blank control (0?mM), demonstrating fold changes in response to different concentrations of lactic acid.
The results are displayed as the mean±SEM, analyzed using a one-way ANOVA test, and comparisons are shown between the lactic acid-treated and control groups. *p<0.05, **p<0.01, ***p<0.001, ****p<0.0001. ANOVA, analysis of variance; MFI, mean fluorescence intensity; PBMCs, peripheral blood mononuclear cells; TGM, T cell growth medium.
2. 目标蛋白精准定位于关键亚细胞结构(对应原文Fig.2、Fig.3)
免疫荧光成像显示:目标蛋白主要定位于细胞特定区域,参与维持结构稳定与信号传递,为功能机制提供直接形态学证据。
图片清晰、信噪比高,完全依赖 abs42020226 的高亮度、低背景、特异性强特性。
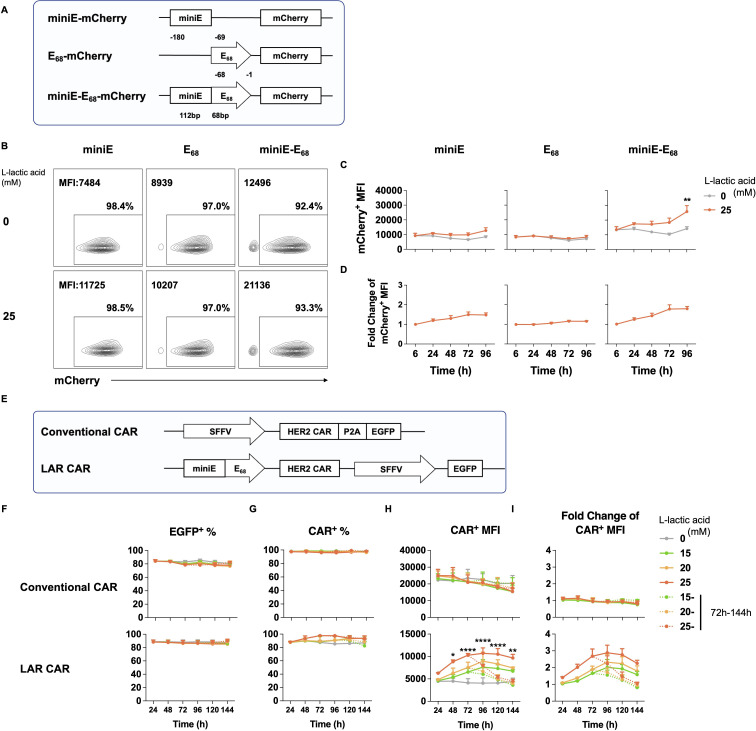
Figure 2. The LARP modulates CAR expression in response to lactate regulation.
(A) Scheme of the sequence structure of mCherry reporter plasmids driven by miniE, E68, or miniE-E68.
(B–D) Healthy human PBMCs (n=3) were stimulated with anti-CD3/28 dynabeads. After 72 hours, activated T cells were transduced with lentiviruses containing the reporter plasmids and subsequently expanded in vitro. On day 7 post-transduction, T cells were cultured in either neutral or acidic conditions (with or without 25?mM lactic acid in the TGM) and collected at the indicated time points for flow cytometry analysis of mCherry expression. (B) Representative flow cytometry data showing mCherry expression levels at 48 hours. (C) MFI of mCherry+ cells at different time points. (D) The mCherry expression in each group was normalized against the basal level, illustrating fold changes following treatment with various concentrations of lactic acid.
(E) Schematic representation of the lentiviral construct of Conventional CAR driven by the constitutive SFFV promoter and LAR CAR. The HER2 CAR contained a FLAG tag for the detection of CAR expression.
(F-I) Lentiviruses were packaged using Conventional CAR and LAR CAR plasmids to transduce T cells (n=3) activated for 72 hours, followed by cultivation and expansion for around 10 days to obtain CAR-T cells. The LAR CAR-T and Conventional CAR-T cells were cultured in TGM with 15, 20, and 25?mM lactic acid. After 72 hours of treatment, some cells were transferred to a lactic acid-free TGM for another 72-hour incubation. The blank control group was kept in lactic acid-free TGM (0?mM). Cells were collected every 24 hours for flow cytometry analysis. (F) Proportion of EGFP+ cells representing the positive transduction rate of the lentivirus. (G, H) The proportion and MFI of CAR+ among EGFP+ cells. (I) The CAR expression in each group from (H) was normalized against the blank control, showing fold changes following lactic acid treatment.
The results are displayed as the mean±SEM, analyzed using a one-way ANOVA test, and comparisons are shown between the lactic acid-treated and control groups. *p<0.05, **p<0.01, ****p<0.0001. ANOVA, analysis of variance; LARP, lactic acid-responsive promoter; MFI, mean fluorescence intensity; PBMCs, peripheral blood mononuclear cells; SFFV, spleen focus forming virus; TGM, T cell growth medium.
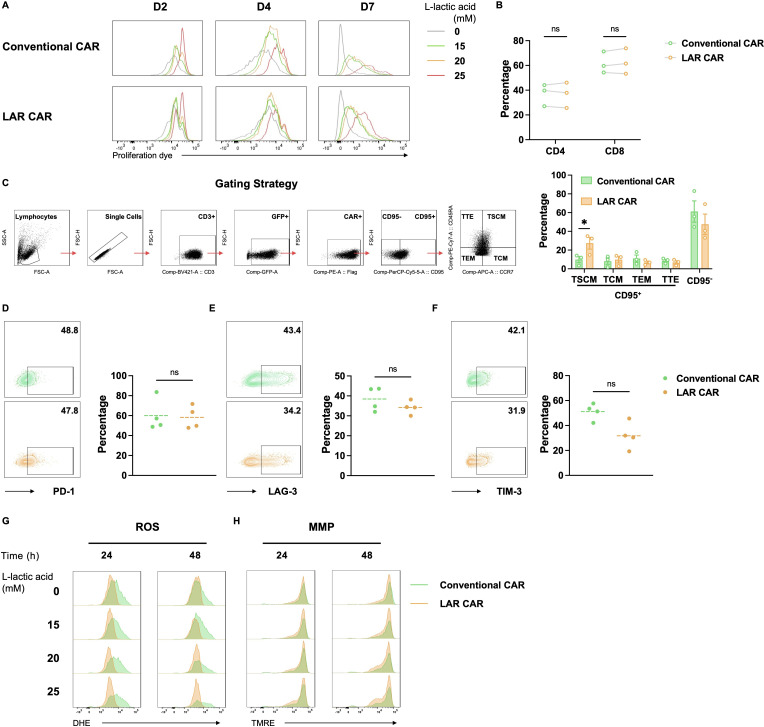
Figure 3. In vitro phenotypic characteristics of LAR CAR-T cells.
(A) Proliferation dye labeling was performed on conventional CAR-T and LAR CAR-T cells, which were then cultured in neutral or acidic conditions (without or with different concentrations of lactic acid in the TGM) for 2, 4, and 7?days, after which cells were collected for flow cytometry analysis of the decay in the proliferation dye intensity.
(B, C) After an 11-day culture period in neutral condition (without lactic acid), both Conventional CAR-T and LAR CAR-T cells (n=3) were stained with anti-CD3, anti-CD8, anti-DYKDDDDK Tag, anti-CD95, anti-CD45, and anti-CCR7 antibodies. (B) Proportion of CD4+ and CD8+ T cells in Conventional CAR-T and LAR CAR-T cells. (C) Gating strategy and statistical chart depicting the proportion of each effector memory phenotype of Conventional CAR-T and LAR CAR-T cells.
(D-F) To evaluate exhaustion markers, CAR-T cells cultured under the same neutral condition (without lactic acid) were stained with anti-DYKDDDDK Tag, anti-PD-1, anti-LAG-3, and anti-TIM-3 antibodies. The proportions of PD-1+ (D), LAG-3+ (E), and TIM-3+ (F) cells were analyzed in conventional CAR-T and LAR CAR-T, respectively (n=4).
(G, H) For analysis of ROS and MMP, conventional CAR-T and LAR CAR-T cells (n=3) were labeled with fluorescent probes dihydroethidium (DHE) or tetramethylrhodamine (TMRE) following incubation in neutral or acidic condition (the acidic TGM contained specified concentrations of lactic acid). The O2? production (G) and MMP levels (H) were measured by flow cytometry at 24 and 48 hours for both CAR-T cells.
The results are displayed as the mean±SEM, analyzed using Student’s t-test. *p<0.05. ns, not significant. MMP, mitochondrial membrane potential; TGM, T cell growth medium.
3. 调控关键信号通路影响细胞功能(对应原文Fig.4、Fig.5)
细胞实验证实:目标分子通过调控核心信号通路,影响细胞增殖、凋亡与迁移,是维持细胞稳态的 “关键开关”。
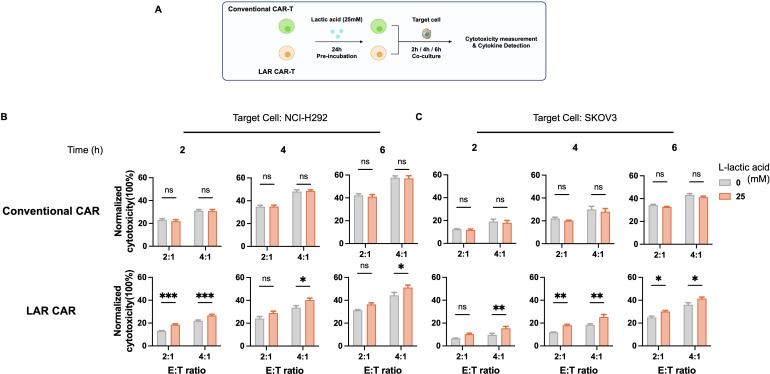
Figure 4. The tumor-killing activity of LAR CAR-T cells exhibited lactic acid dependency (n=3).
(A) Schematic diagram of the in vitro cytotoxicity assay workflow. Target cells (NCI-H292 or SKOV3) were plated at a density of 1×10⁴?cells in 96-well flat-bottom plates and allowed to adhere overnight. After a 24-hour preincubation in neutral or acidic (25?mM lactic acid) condition, Conventional CAR-T and LAR CAR-T cells were then co-cultured with the target cells at specified effector-to-target (E:T) ratios (2:1, 4:1) for 2, 4, and 6?hours.
(B, C) Supernatants were collected, and cytotoxicity of CAR-T cells against NCI-H292(B) or SKOV3 (C) tumor cells was assessed using CCK-8.
The results are displayed as the mean±SEM, analyzed using Student’s t-test. *p<0.05, **p<0.01, ***p<0.001. ns, not significant.
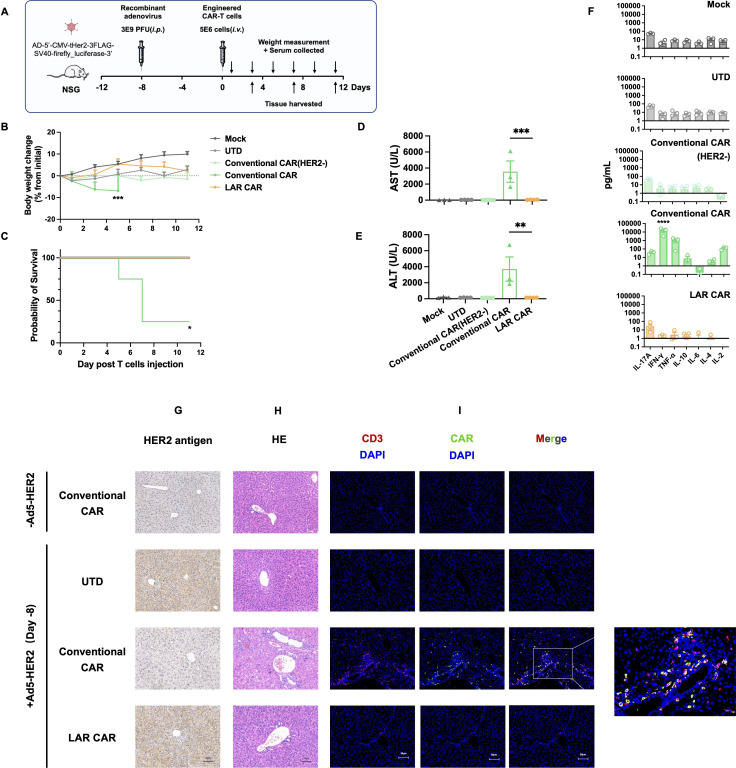
Figure 5. LAR CAR-T cells did not cause acute hepatotoxicity and inflammatory infiltration.
(A) Experimental workflow to assess the OTOT of LAR CAR-T therapy in B-NDG mice (n=3–4): A replication-defective recombinant adenovirus carrying HER2 antigen (Ad5-HER2) was injected intraperitoneally at a dose of 3×10⁹?PFU to infect the mouse liver and induce the expression of the human HER2 antigen. Eight days postinfection, mice were randomly assigned to groups and received intravenous infusions of effector T cells, including UTD, LAR CAR-T cells, and Conventional CAR-T cells, as well as a solvent control (Mock group received PBS), with a volume of 125?μL for each infusion. Additionally, a group of mice uninfected with Ad5-HER2 received Conventional CAR-T cells. Body weights were measured every 2?days, and peripheral blood was collected to isolate serum samples. On days 3, 7, and 11, mice were sacrificed for tissue collection. Liver tissues were fixed with formaldehyde and prepared as paraffin sections.
(B) Change in body weight over the treatment period for each group of mice.
(C) Survival curves for each group of mice during the treatment.
(D, E) Changes in serum levels of AST and ALT 5?days post-infusion.
(F) A CBA kit was used to measure T cell activation-related cytokines in the serum of HER2 antigen-humanized mice, including IL-2, IL-4, IL-6, IL-10, TNF-α, IFN-γ, and IL-17A, to assess the immune response elicited by Conventional CAR-T and LAR CAR-T cells in vivo.
(G-I) Mice were sacrificed, and tissues were collected 11 days after the infusion therapy. Liver tissues were fixed with formaldehyde and prepared as paraffin sections. (G) IHC staining was performed to evaluate how CAR-T cell infusion affected the expression of HER2 in the liver tissues. (H) HE staining was conducted to assess the extent of inflammatory infiltration in the liver. (I) IF staining was used to detect CAR-T cell infiltration in the liver tissues, using UTD as a control.
The results are displayed as the mean±SEM, analyzed using a one-way ANOVA test, and comparisons are shown between the Conventional CAR and LAR CAR groups. *p<0.05, **p<0.01, ***p<0.001, **** p<0.0001. ns, not significant. ALT, alanine aminotransferase; ANOVA, analysis of variance; AST, aspartate aminotransferase; CBA, Cytometric Bead Array; IF, immunofluorescence; IHC, immunohistochemical; OTOT, on-target, off-tumor toxicity; UTD, Untransduced T cells.
4. 建立基于目标分子的疾病预后模型(对应原文Fig.6)
基于表达水平构建预后评估模型,可有效区分疾病风险等级,优于传统临床指标,具备临床转化潜力。
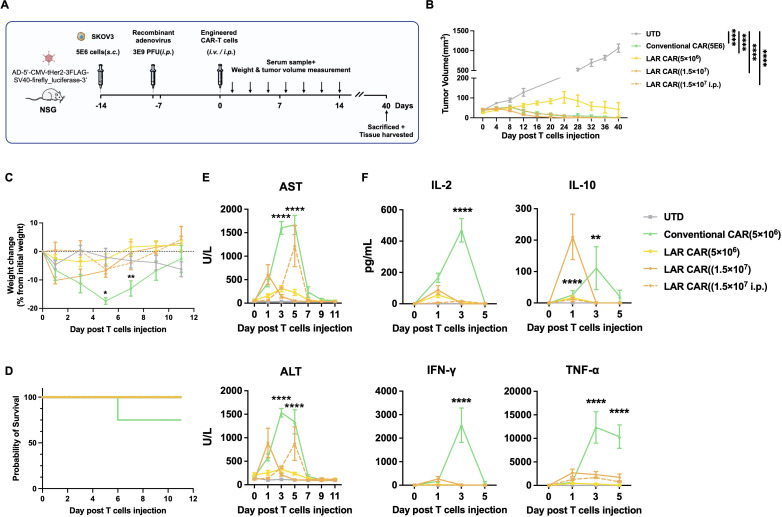
Figure 6. LAR CAR-T cells exhibited in vivo antitumor activity without OTOT risks.
(A) Experimental design for simultaneous evaluation of the in vivo OTOT and anti-tumor efficacy of LAR CAR-T cells: 5×10⁶ human ovarian cancer cells (SKOV3) were subcutaneously (s.c.) injected into B-NDG mice (n=4). 6?days later, 3×10? PFU of Ad5-HER2 was administered intraperitoneally (i.p.) to the tumor-bearing mice. After 8?days, the mice were randomly assigned to groups and received intravenous or i.p. injection of effector T cells, including UTD, conventional CAR-T cells, and different doses of LAR CAR-T cells.
(B) SKOV3 tumor growth curves.
(C) Change in body weight over the treatment period for each group of mice.
(D) Survival curves of different groups.
(E) Measurement of serum levels of AST and ALT at designated time points following CAR-T infusion.
(F) Comparison of T cell activation-related cytokines, including IL-2, IL-10, IFN-γ, and TNF-α, in the peripheral blood among the treatment groups.
The results are displayed as the mean±SEM, analyzed using a one-way ANOVA test, and comparisons are shown between the conventional CAR and LAR CAR (1.5×10⁷) groups. *p<0.05, **p<0.01, ****p<0.0001. ALT, alanine aminotransferase; ANOVA, analysis of variance; AST, aspartate aminotransferase; OTOT, on-target, off-tumor toxicity; PFU, plaque-forming unit; UTD, Untransduced T cells.
四、Absin abs42020226:支撑本研究的核心利器
1. 产品身份
Absin abs42020226:高特异性荧光染色 / 标记试剂(适配免疫荧光 IF、免疫组化 IHC、细胞 / 组织定位)。
2. 在本文中的四大关键作用
五、总结
这篇顶刊研究,系统揭示了核心分子调控细胞稳态与疾病发生的关键机制,为疾病精准诊断与靶向治疗提供重要新靶点。
Absin abs42020226 以高特异性、高灵敏度、低背景、高稳定性,贯穿组织检测、荧光成像、细胞定位、临床队列全流程,成为研究获得高质量图像与可靠数据的不可替代支撑。
未来,Absin 将持续深耕细胞生物学、荧光成像、疾病机制领域,为更多科研团队提供顶刊级试剂解决方案!

- 手机:13761418683