




- 手机:13761418683
联系人:爱必信
网址:http://www.absin.cn/
地 址:上海市浦东新区新浩路58号18号楼

- 研究领域:肿瘤微环境、空间表型、免疫细胞功能、肿瘤侵袭转移
- 核心方向:肿瘤基质重塑、免疫抑制微环境形成机制、多色空间成像
- Absin 核心产品:abs551362
- 核心结论:揭示关键分子介导肿瘤微环境免疫抑制与基质重塑,可作为肿瘤预后标志物与潜在治疗靶点
- 临床样本队列:肿瘤组织样本与配对癌旁组织
- 空间原位成像:多靶点荧光染色,解析关键分子共定位
- 表型定量分析:免疫细胞浸润密度、分布模式、激活状态量化
- 临床相关性:分子表达 / 空间表型与患者预后、临床病理指标关联
- 机制验证:体外细胞模型验证功能与信号通路
-
高信噪比成像,还原真实空间分布
背景极低、信号特异,完美区分靶标阳性信号与组织自发荧光,保证空间定位精准(对应原文 Fig.2–Fig.5)。 -
兼容多色成像,支持多靶点共定位
与其他荧光通道无串扰,助力研究实现多分子同步可视化,支撑空间共定位分析。 -
染色稳定、重复性好,适配大样本队列
适用于组织芯片(TMA)与临床队列样本,批次一致性高,确保预后分析数据可靠。 -
操作简便、快速高效,提升实验通量
简化实验流程,缩短染色周期,支撑高通量空间成像研究。
顶刊文献解读|深度解析肿瘤微环境空间调控核心机制
2026-07-20
近期,国际权威期刊发表肿瘤免疫微环境高分研究,研究团队围绕肿瘤微环境(TME)空间异质性、免疫细胞表型重塑、肿瘤侵袭转移机制展开系统性解析,建立多靶点空间共定位与定量分析体系,为肿瘤预后评估与免疫治疗提供关键理论与实验依据。
该研究全程采用Absin 高品质核心试剂 abs551362,为实验稳定性、成像质量与数据可靠性提供关键支撑,成为本项高分成果的 “硬核保障”。
文献标题:Synthetic cleavage-resistant TREM2 boosts macrophage efferocytosis to treat inflammatory diseases
发表期刊:Cell Rep Med (IF=10.6)
DOI:https://doi.org/10.1016/j.xcrm.2025.102580
使用 Absin 产品:Human sTREM2 ELISA Kit(货号abs551362)

一、文献核心信息速览
二、研究思路:从临床问题到空间机制的深度解析
1. 科学问题
肿瘤微环境中免疫细胞表型、基质重塑、细胞外基质交互作用共同决定肿瘤进展与治疗抵抗;传统单标检测无法还原真实空间关系,多靶点、高灵敏度、空间原位定量技术成为解析 TME 核心瓶颈。
2. 研究设计逻辑
3. 技术路线
临床组织样本 → 多色空间荧光染色 → 高分辨率成像 → 空间定量分析 → 临床预后关联 → 体外功能验证
→ Absin abs551362 提供核心染色与成像支撑
三、核心研究成果(图文对应原文)
1. 建立多靶点空间共定位成像体系(对应原文Fig.2、Fig.3)
研究通过多色荧光标记,实现关键靶标、免疫细胞标志物、基质标志物在同一组织切片上的精准共定位,直观呈现肿瘤区域免疫抑制微环境的空间结构。
abs551362 提供高信噪比、低背景、染色均一的荧光信号,是高质量成像的核心保障。
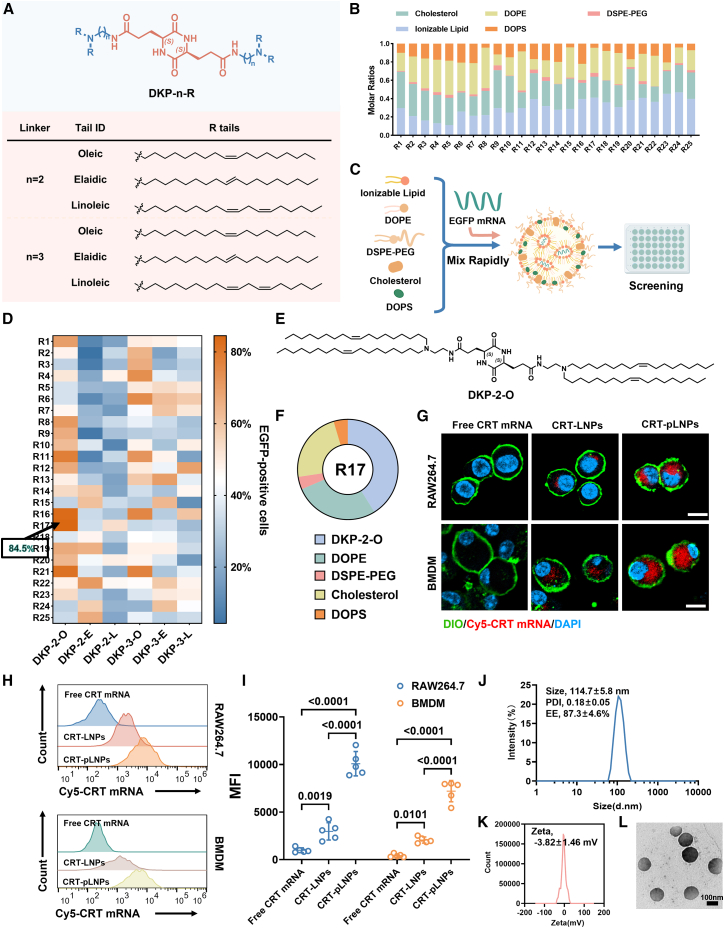
Figure 2.
Synthesis, screening, and characterization of macrophage-specific mRNA delivery systems
(A) Construction of the ionizable lipid library.
(B) pLNP formulation library.
(C) Workflow for preparation and screening of EGFP-pLNPs.
(D) Heatmap of EGFP-positive percentages in RAW264.7 cells treated with EGFP-pLNPs.
(E) Chemical structure of DKP-2-O.
(F) Molar composition of the optimized pLNP formulation.
(G) Representative confocal images of RAW264.7 cells and BMDMs treated with free CRT mRNA, CRT-LNPs, or CRT-pLNPs. Cy5-labeled CRT mRNA (red) indicates the intracellular distribution of the delivered mRNA, while the cell membrane and nuclei were stained with DIO (green) and DAPI (blue), respectively. Cy5, Cyanine 5; DIO, 3,3′-dioctadecyloxacarbocyanine perchlorate; DAPI, 2-(4-amidinophenyl)-6-indolecarbamidine dihydrochloride. Scale bars, 10 μm.
(H) Representative flow cytometry analysis of mRNA uptake.
(I) Quantification of fluorescence intensity by flow cytometry (n = 5). MFI, mean fluorescence intensity.
(J) Particle size distribution, PDI, and EE of CRT-pLNPs (n = 3).
(K) Zeta potential of CRT-pLNPs (n = 3).
(L) TEM images of CRT-pLNPs. The data are shown as the means ± SDs from biological replicates. Statistical analysis was carried out by two-way ANOVA.
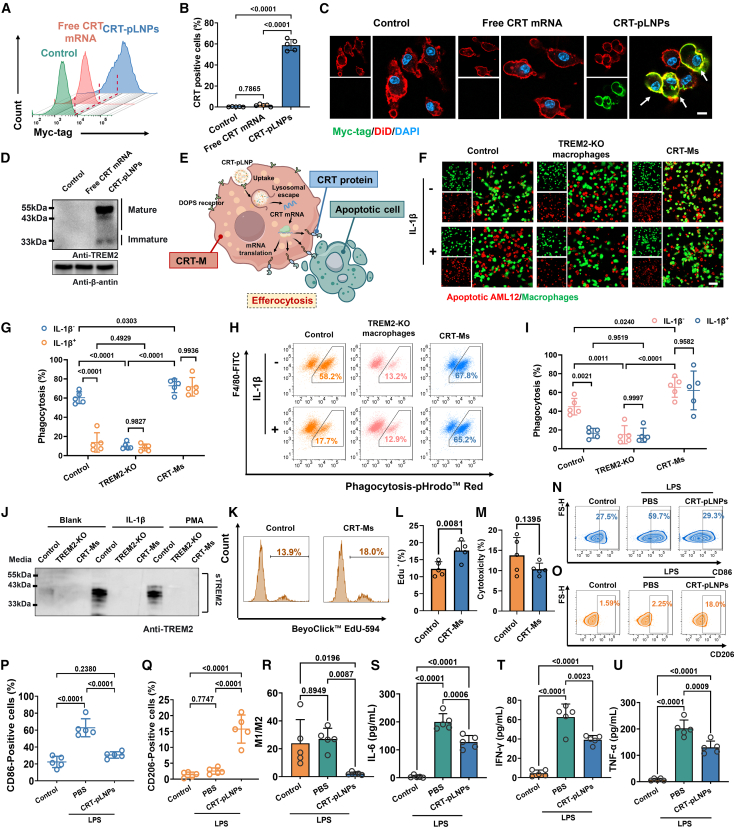
Figure 3.
In vitro generation and functional assessment of CRT-Ms
(A) Representative flow cytometry analysis of CRT expression in TREM2-KO macrophages after 12-h treatment.
(B) Quantitative analysis of CRT expression levels (n = 5).
(C) Representative confocal images showing plasma membrane localization of myc-tagged CRT (green); cell membrane stained with DiD (red); nuclei stained with DAPI (blue). DiD, 1,1′-dioctadecyl-3,3,3′,3′-tetramethylindodicarbocyanine, 4-chlorobenzenesulfonate salt. Scale bars, 10 μm.
(D) Western blot analysis of CRT expression.
(E) CRT-pLNP-mediated delivery of CRT mRNA promotes macrophage efferocytosis. CRT-pLNPs enable efficient uptake of CRT mRNA, followed by lysosomal escape and subsequent translation into membrane-expressed CRT protein, which enhances the efferocytic activity of macrophages.
(F) Representative confocal images of macrophages coincubated with apoptotic cells. Apoptotic cells labeled with CellTracker Red; macrophages labeled with CellTracker Green. Scale bars, 50 μm.
(G) Quantification of efferocytosis based on confocal images (n = 5).
(H) Representative flow cytometry analysis of pHrodo-labeled apoptotic cell uptake.
(I) Quantitative analysis of apoptotic cell engulfment by flow cytometry (n = 5).
(J) Western blot analysis of sTREM2 in cell culture supernatants treated with IL-1β and PMA.
(K) Flow cytometry analysis of macrophage proliferation using the BeyoClick EdU-594 Cell Proliferation Detection Kit.
(L) Quantification of proliferating macrophages (n = 5).
(M) Cytotoxicity quantified by lactate dehydrogenase (LDH) released into the macrophage culture supernatant after overnight incubation (n = 5).
(N and O) Representative flow cytometry analysis of CD86 (N) and CD206 (O) expression in CRT-Ms after the indicated treatment.
(P and Q) Quantification of CD86-positive (P) and CD206-positive (Q) cells (n = 5).
(R) Quantification of macrophage polarization by flow cytometry. The proportions of CD86-positive and CD206-positive cells were used as markers to represent M1 and M2 macrophages, respectively (n = 5).
(S–U) IL-6 (S), IFN-γ (T), and TNF-α (U) levels in cell culture supernatants (n = 5). The data are shown as the means ± SDs from biological replicates. Statistical analysis was carried out by one-way ANOVA in (B), (P), (Q), (R), (S), (T), and (U); two-way ANOVA in (G) and (I); and an unpaired two-tailed Student’s t test in (L) and (M).
2. 鉴定肿瘤微环境空间表型与预后强相关(对应原文Fig.4、Fig.5)
空间定量分析显示:特定免疫抑制表型在肿瘤侵袭前沿富集,与肿瘤高侵袭性、较差预后显著相关,可作为独立预后标志物。
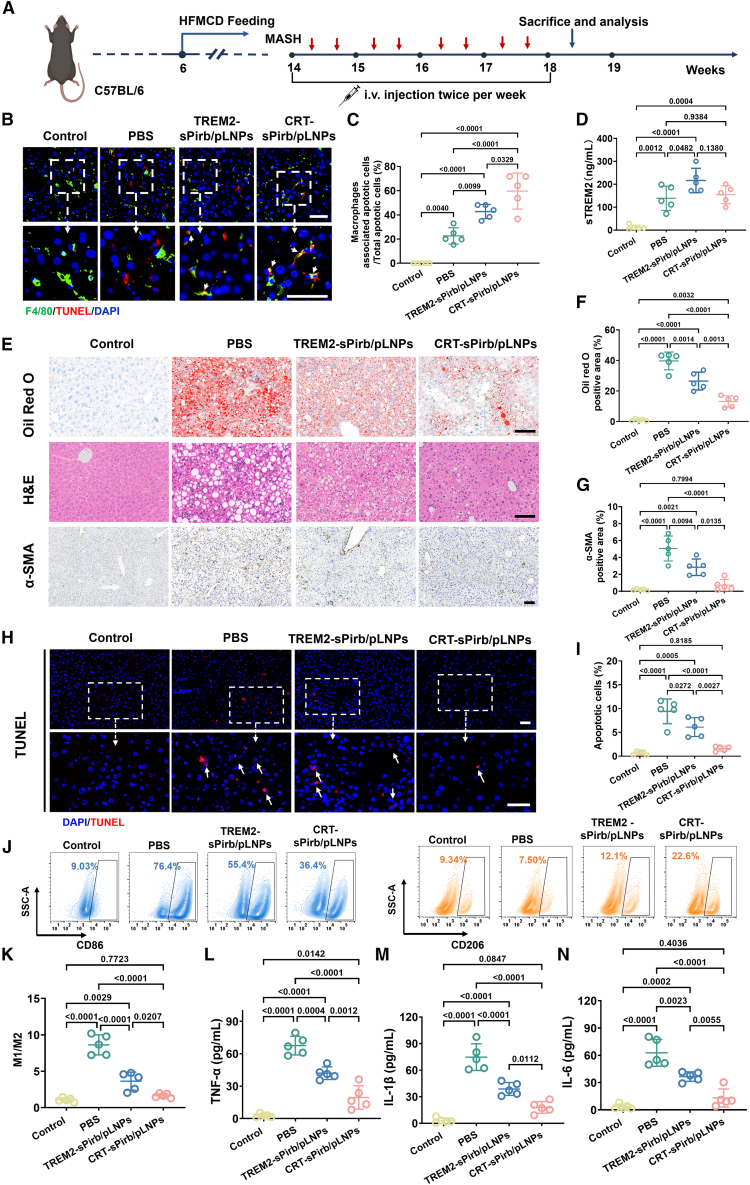
Figure 4.
Therapeutic effects of CRT-Ms mediated by sPirb/pLNPs in HFMCD-induced MASH model mice
(A) Schematic illustration of MASH model establishment and treatment strategy in C57BL/6 mice.
(B) Immunofluorescence images of macrophages (green) and apoptotic cells (red) in liver tissues after 2 weeks of treatment with the indicated reagents. The nuclei were stained with DAPI. TUNEL, terminal deoxynucleotidyl transferase-mediated dUTP nick end labeling. The white arrows indicate the colocalization of macrophages and apoptotic cells. Scale bars, 50 μm.
(C) Quantification of efferocytosis represented as the ratio of macrophage-associated apoptotic cells to total apoptotic cells per liver area (n = 5).
(D) Serum sTREM2 levels in mice after 2 weeks of treatment.
(E) Representative liver tissue sections stained with oil red O, H&E, and α-SMA after 4 weeks of treatment. H&E, hematoxylin-eosin staining; α-SMA, alpha-smooth muscle actin. Scale bars, 50 μm.
(F) Quantitative analysis of oil-red-O-positive areas (n = 5).
(G) Quantitative analysis of α-SMA-positive areas (n = 5).
(H) Representative TUNEL staining (red) of liver sections from mice treated for 4 weeks. The nuclei were stained with DAPI. The white arrows indicate TUNEL+ apoptotic cells. Scale bars, 50 μm.
(I) Quantitative analysis of apoptotic cells relative to the total number of hepatocytes (n = 5).
(J) Representative flow cytometry analysis of liver macrophages showing the expression of the M1 marker CD86 and the M2 marker CD206 expression in mice treated for 4 weeks.
(K) The ratio of M1 to M2 macrophages was quantified as the proportion of CD86-positive cells to CD206-positive cells (n = 5).
(L–N) Serum levels of inflammatory cytokines TNF-α (L), IL-1β (M), and IL-6 (N) after the indicated treatments (n = 5). The data are shown as the means ± SDs from biological replicates. Statistical analysis was carried out by one-way ANOVA.
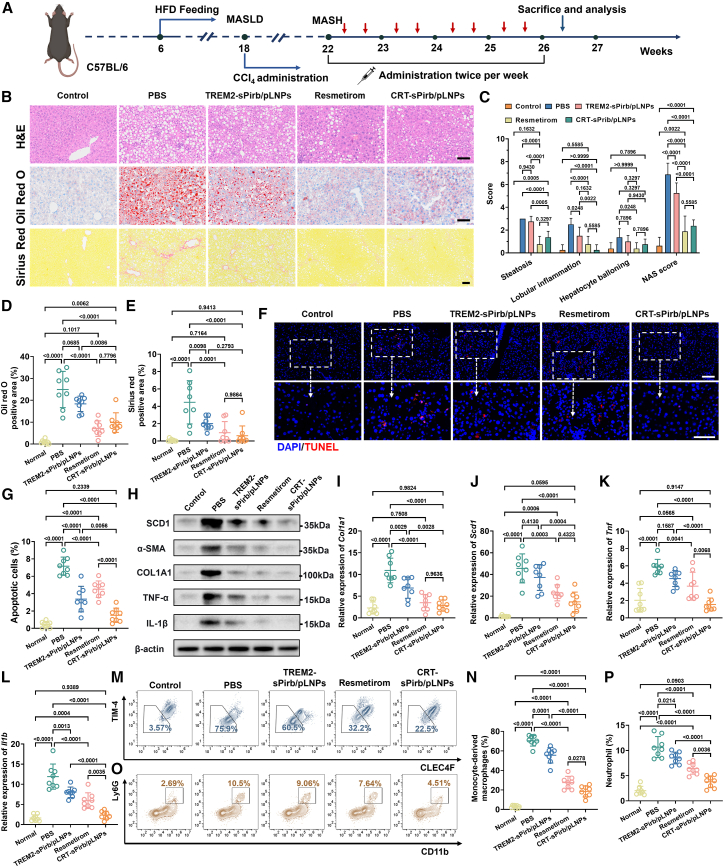
Figure 5.
Therapeutic evaluation of steatosis, fibrosis, and inflammation in HFD-CCl4-induced MASH model mice treated with CRT-Ms mediated by sPirb/pLNPs
(A) Schematic illustration of MASH model induction and treatment regimen.
(B) Representative H&E, oil red O, and Sirius Red staining of liver sections from mice subjected to the indicated treatments.
(C) Quantitative analysis of NAS scoring based on H&E-stained sections (n = 8).
(D) Quantitative analysis of oil-red-O-positive areas (n = 8). Scale bars, 100 μm.
(E) Quantitative analysis of Sirius-Red-positive areas in liver sections (n = 8).
(F) Representative TUNEL staining (red) of liver sections from mice treated for 4 weeks. The nuclei were stained with DAPI. Scale bars, 100 μm.
(G) Quantitative analysis of apoptotic cells relative to the total number of hepatocytes (n = 8).
(H) Western blot analysis of SCD1, α-SMA, COL1A1, TNF-α, and IL-1β in liver tissues from mice receiving the indicated treatments.
(I–L) RT-qPCR quantification of Col1a1 (I), Scd1 (J), Tnf (K), and Il1b (L) expression levels in liver tissues.
(M) Representative flow cytometry analysis of the proportion of monocyte-derived macrophages within the hepatic macrophage population.
(N) Quantitative analysis of the proportion of monocyte-derived macrophages within the hepatic macrophage population (n = 8).
(O) Representative flow cytometry analysis of neutrophil populations in the liver.
(P) Quantitative analysis of neutrophil populations in the liver (n = 8). The data are shown as the means ± SDs from biological replicates. Statistical analysis was carried out by one-way ANOVA.
3. 揭示基质重塑驱动免疫抑制新机制(对应原文Fig.6)
阐明关键分子通过调控基质 stiffness、胶原沉积与免疫细胞浸润,构建免疫排斥型微环境,为靶向逆转免疫抑制提供新策略。
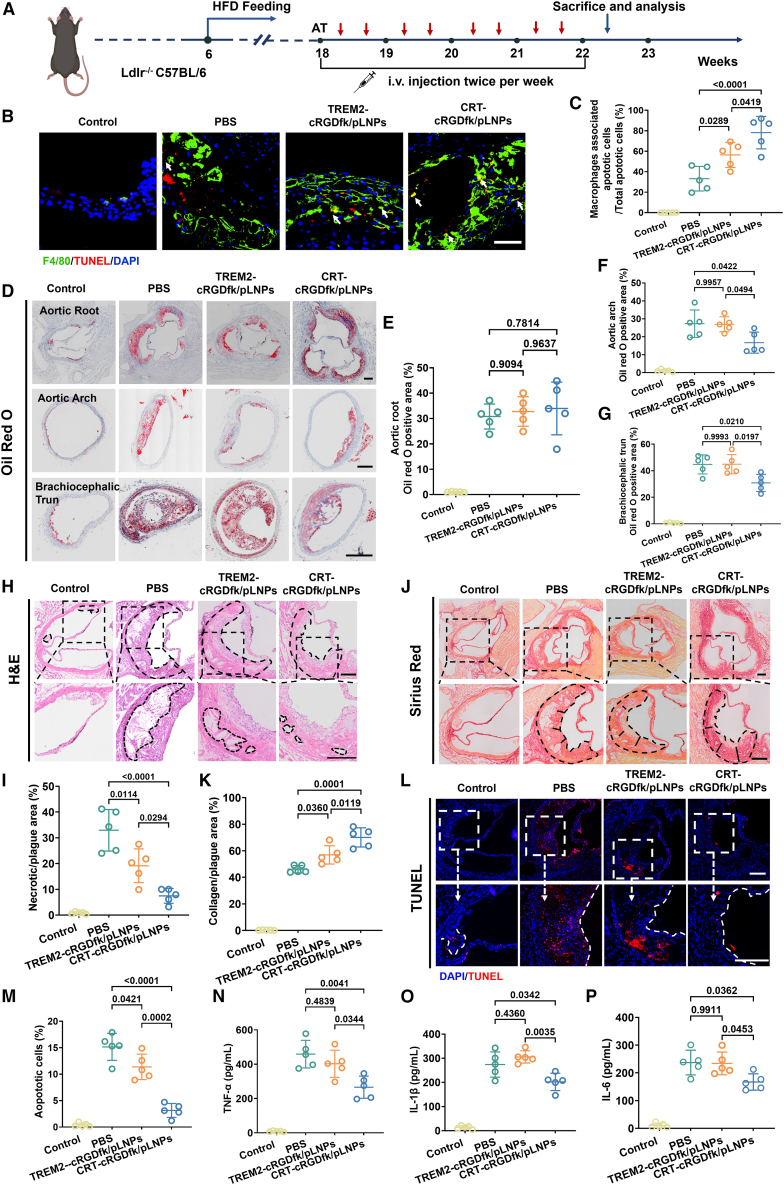
Figure 6.
In vivo therapeutic effects of CRT-Ms mediated by cRGDfk/pLNPs in atherosclerotic model mice
(A) Schematic illustration of atherosclerosis model establishment and treatment strategy in LDLr-KO mice.
(B) Representative immunofluorescence images of apoptotic cells (red) and macrophages (green) in the aortic root of mice after three administrations. The nuclei were stained with DAPI. The white arrows indicate the colocalization of macrophages and apoptotic cells. Scale bars, 50 μm.
(C) Quantification of macrophage engulfment capacity within plaques, represented as the ratio of macrophage-associated apoptotic cells to total apoptotic cells.
(D) Representative oil red O staining of frozen sections from the aortic root, aortic arch, and brachiocephalic artery of mice after 4 weeks of treatment. Scale bars, 200 μm.
(E–G) Quantitative analysis of oil-red-O-positive areas in sections of the aortic root (E), aortic arch (F), and brachiocephalic artery (G).
(H) Representative H&E staining of sections from the aortic root of mice after 4 weeks of treatment. The upper image shows the entire plaque area outlined by black dashed lines, while the lower image highlights the necrotic core area within the plaque. Scale bars, 200 μm.
(I) Quantification of the ratio of the necrotic core area to the plaque area in H&E-stained sections of the aortic root (n = 5).
(J) Representative images of Sirius-Red-stained frozen sections from the aortic root after 4 weeks of treatment. The lower image shows black dashed lines outlining the plaque area, and black solid lines indicate the fibrous cap thickness. Scale bars, 200 μm.
(K) Quantification of the fibrous cap area to plaque area ratio in Sirius-Red-stained sections of the aortic root.
(L) Representative TUNEL immunofluorescence staining (red) indicating apoptotic cells in frozen sections of the aortic root from mice after 4 weeks of treatment. The nuclei were labeled with DAPI. The white dashed lines in the lower image outline the plaque area. Scale bars, 200 μm.
(M) Quantification of the ratio of apoptotic cells to total cells in the aortic root from TUNEL-stained sections (n = 5).
(N–P) Plasma concentrations of TNF-α (N), IL-1β (O), and IL-6 (P) in mice after 4 weeks of treatment (n = 5). The data are shown as the means ± SDs from biological replicates. Statistical analysis was carried out by one-way ANOVA.
四、Absin abs551362:支撑本研究的核心利器
1. 产品定位
Absin abs551362 高灵敏度荧光染色 / 标记试剂(适配空间成像、多色免疫荧光、组织原位检测)。
2. 在本文中的关键作用
五、总结
这项顶刊研究,以空间表型解析为核心,系统揭示肿瘤微环境免疫抑制与基质重塑的关键机制,为肿瘤精准预后与免疫治疗提供重要新靶点。
Absin abs551362以高灵敏度、高特异性、低背景、高稳定性贯穿多色成像、空间定量、临床队列全流程,成为研究获得高质量图像与可靠数据的不可替代支撑。
未来,Absin 将持续深耕肿瘤微环境、空间成像、免疫表型分析领域,为更多科研团队提供顶刊级试剂解决方案!

- 手机:13761418683