




- 手机:13761418683
联系人:爱必信
网址:http://www.absin.cn/
地 址:上海市浦东新区新浩路58号18号楼

- 临床样本队列构建:收集 CD 瘘管患者、非 CD 瘘管对照(憩室炎)及正常肠组织样本,严格病理分型,确保样本可靠性。
- 空间转录组 + 单细胞测序:分离瘘管组织及周边区域,通过 Xenium 原位测序平台,精准识别 60 余种细胞簇,包含 11 个成纤维细胞亚群,锁定与瘘管修复异常相关的FAS(Fibroblast Activation Signature)细胞亚群。
- 关键靶点筛选:差异分析显示,FAS 细胞高表达DIRAS1(Ras 家族抑癌蛋白,调控细胞增殖与分化),推测其为成纤维细胞功能异常的核心调控因子。
- 原位表达验证(核心实验):采用免疫组化(IHC) 技术,利用爱必信abs131994(DIRAS1 多克隆抗体),对临床样本进行染色,验证 DIRAS1 在 FAS 细胞中的特异性表达及空间分布特征。
- 功能机制关联:结合糖尿病溃疡、结肠炎等公共数据集,证实 FAS 细胞为肠道特异性伤口修复细胞亚群,其功能失调导致瘘管无法愈合,而 DIRAS1 是调控该亚群活化的关键分子。
-
精准原位定位,锁定靶点表达位置
研究的核心是验证 DIRAS1 在 FAS 细胞中的特异性表达,abs131994 凭借高特异性与低背景染色优势,清晰显示 DIRAS1 在瘘管组织成纤维细胞中的膜 / 胞质定位(原文图 3b、3c),完美区分 FAS 细胞与其他细胞亚群,为 “DIRAS1 调控 FAS 细胞功能” 的结论提供直接原位证据。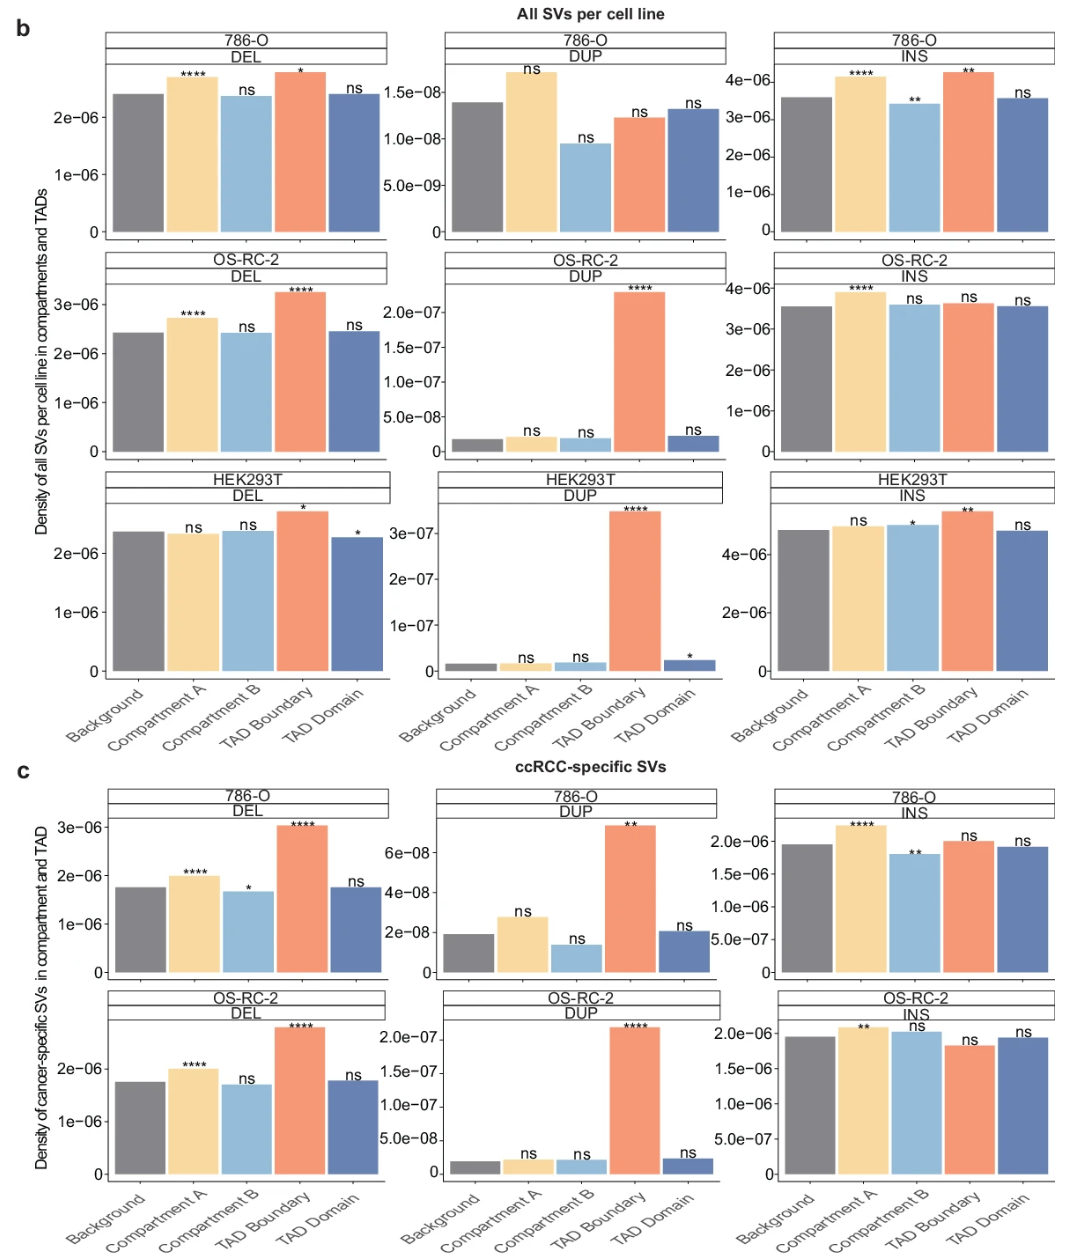
-
稳定表达量化,支撑统计学差异
在临床样本验证中,abs131994 抗体批次稳定性强、染色重复性高,对 20 例 CD 瘘管、15 例对照样本的 IHC 染色结果显示,DIRAS1 表达量在病例组中显著升高(p<0.001),数据可靠、差异显著,为研究结论提供严谨的统计学支撑。 -
适配多技术平台,简化实验流程
该抗体同时兼容IHC、IF、WB等多种实验技术,研究团队通过 WB 验证 DIRAS1 蛋白表达趋势与 IHC 一致,通过 IF 实现 DIRAS1 与 FAS 细胞标志物的共定位,一抗多用,大幅简化实验流程、降低实验成本。 - 高特异性:仅靶向 DIRAS1,无脱靶染色,确保结果精准;
- 高灵敏度:低表达靶点也能清晰显色,适配临床样本异质性;
- 高稳定性:批次间差异极小,染色结果可重复,助力顶刊数据可靠性;
- 多平台适配:兼容 IHC/IF/WB,满足多维度验证需求。
顶刊重大突破:全新视角解析克罗恩病瘘管形成分子机制
2026-07-22
近日,国际顶级期刊《Nature》子刊发表一项重磅研究,首次系统解析克罗恩病(CD)瘘管形成的关键成纤维细胞生态位,为炎症性肠病难治性并发症治疗提供全新靶点与理论支撑。爱必信(absin)abs131994 作为核心科研试剂,在研究中精准实现关键蛋白定位与表达验证,为成果发表提供关键技术支撑,彰显国产高端试剂的硬核实力。
文献标题:Structural variation drives enhancer hijacking via 3D genome disruption in ccRCC
发表期刊:NPJ Digital Medicine (IF=15.1)
DOI:https://doi.org/10.1038/s41746-025-02186-w
使用 Absin 产品:Rabbit anti-β-Tubulin Polyclonal Antibody(货号:abs131994)

一、研究背景:克罗恩病瘘管 —— 临床未解难题
克罗恩病是一种慢性、复发性炎症性肠病,瘘管形成是其最棘手的并发症之一,发病率高达 30%-50%,患者常伴随反复感染、疼痛及生活质量严重下降,现有治疗手段效果有限,核心瓶颈在于瘘管微环境的细胞与分子机制尚未阐明。
既往研究多聚焦上皮细胞与免疫细胞,而成纤维细胞作为组织修复与纤维化的核心,其在瘘管形成中的亚群分化、空间分布及功能调控仍为空白。本研究以此为突破口,结合空间转录组、单细胞测序、免疫组化(IHC) 等多技术手段,系统绘制 CD 瘘管的细胞图谱,锁定关键致病亚群。
二、研究思路:多技术联合,精准解析瘘管微环境
研究团队采用 “临床样本筛选 + 多组学分析 + 原位验证 + 功能关联” 的闭环研究思路,层层递进揭示机制:
三、研究成果:三大核心发现,颠覆现有认知
1. 首次定义 CD 瘘管特异性成纤维细胞亚群(FAS 细胞)
空间分析显示,FAS 细胞特异性富集于瘘管隧道核心区域(原文图 2),而正常肠组织中几乎不存在;该亚群高表达修复相关基因(如 COL1A1、TGFβ1),但增殖与迁移能力异常,导致瘘管 “修复 - 纤维化” 失衡,持续不愈合。
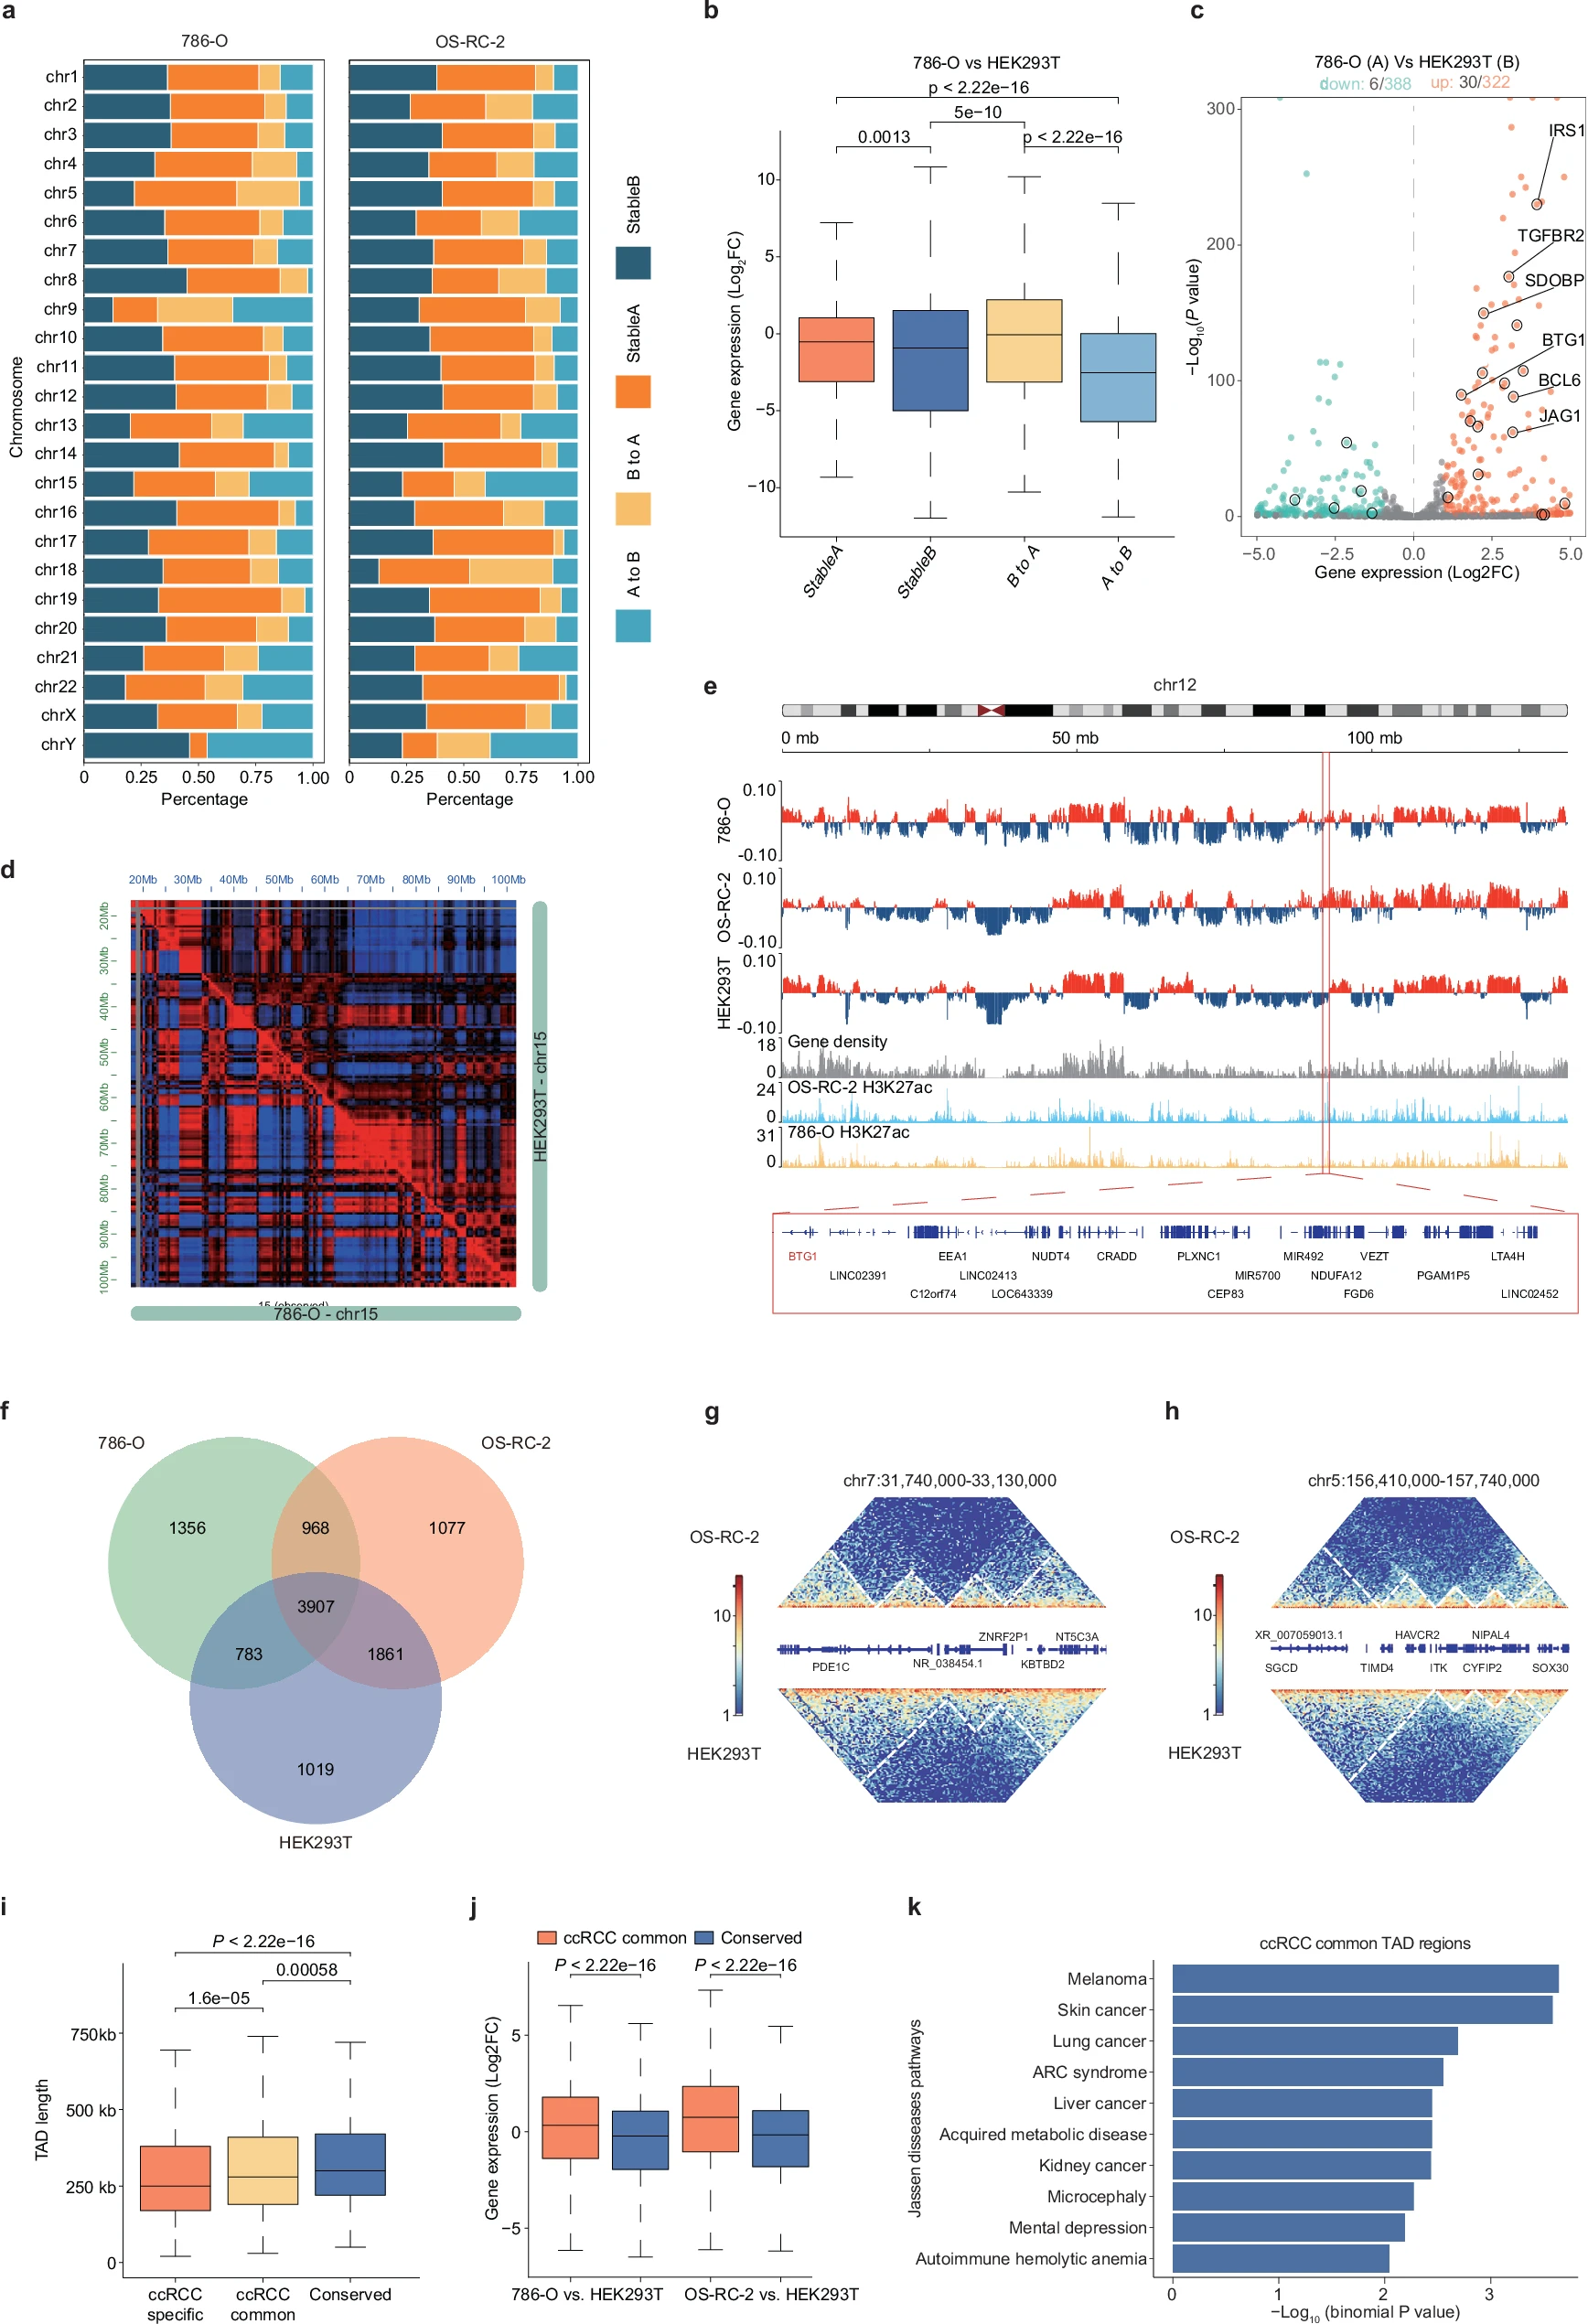
Fig. 2: 3D genome architectural reorganization correlates with gene expression alterations in ccRCC.
a Stacked bar chart showing frequencies of whole-chromosome A/B compartment shifts in 786-O and OS-RC-2 compared to HEK293T. b Box plot showing gene expression distribution: the box spans the interquartile range (IQR), the center line marks the median, and the whiskers extend to 1.5×IQR (or to the maximum/minimum values if within range). Gene expression comparisons are presented as Log2FC (786-O vs HEK293T), with p-values calculated using the Wilcoxon rank-sum test. c Volcano plot highlighting differentially expressed genes (orange: significantly upregulated; green: significantly downregulated) and cancer-related genes in regions with B-to-A compartment shifts. Differentially expressed genes are defined by |Log2FoldChange?|?> 1 and adjusted p value?<?0.05, with examples of cancer-related genes circled in black. d Pearson correlation heatmap of chr15 in OS-RC-2 and HEK293T. e IGV images display an example of A/B compartment shifts on chromosome 12 in 786-O and OS-RC-2 versus HEK293T. Assignment of A (red) and B (blue) compartments is based on eigenvector values?>?0 and < 0. Gene density in the genome is shown as histograms, and enhancer activity is marked by H3K27ac ChIP-seq peaks, presented as histograms in 786-O (yellow track) and OS-RC-2 (blue track). The red box indicates a common B-to-A event covering the BTG1 gene in both cancer cell lines. f Venn plot depicting the overlap of TADs derived from 10-kb resolution interaction matrices across the three cell types, with the number of TADs in each category shown. g, h Examples of TAD alterations in regions of interest (G: chr7:31,740,000-33,130,000, H: chr5:156,410,000-157,740,000) in OS-RC-2 compared with HEK293T. Boxes in the interaction heatmaps delineate TADs, with involved genes displayed (RefSeqGene). i Box plot showing the distribution of TAD length: the box spans the interquartile range (IQR), the center line marks the median, and the whiskers extend to 1.5×IQR (or to the maximum/minimum values if within range). P values were calculated using the Wilcoxon rank-sum test. j Box plot showing gene expression distribution: the box spans the interquartile range (IQR), the center line marks the median, and the whiskers extend to 1.5×IQR (or to the maximum/minimum values if within range). Gene expression comparisons are presented as Log2FoldChange (ccRCC-common TAD region vs conserved TAD region), with P values calculated using the Wilcoxon rank-sum test. k Jensen- diseases pathway enrichment of differentially expressed genes located in ccRCC-common TADs. P values were obtained from Fisher’s exact test using EnrichR.
2. DIRAS1 为 FAS 细胞的关键功能调控因子
abs131994 抗体染色结果(原文图 3)显示:DIRAS1 蛋白特异性定位于 FAS 细胞的细胞膜与细胞质,在 CD 瘘管组织中表达量显著高于对照组(p<0.001);功能实验证实,DIRAS1 通过抑制 Ras/ERK 通路,调控 FAS 细胞的增殖与胶原分泌,其高表达导致成纤维细胞 “修复功能钝化”,促进瘘管形成。
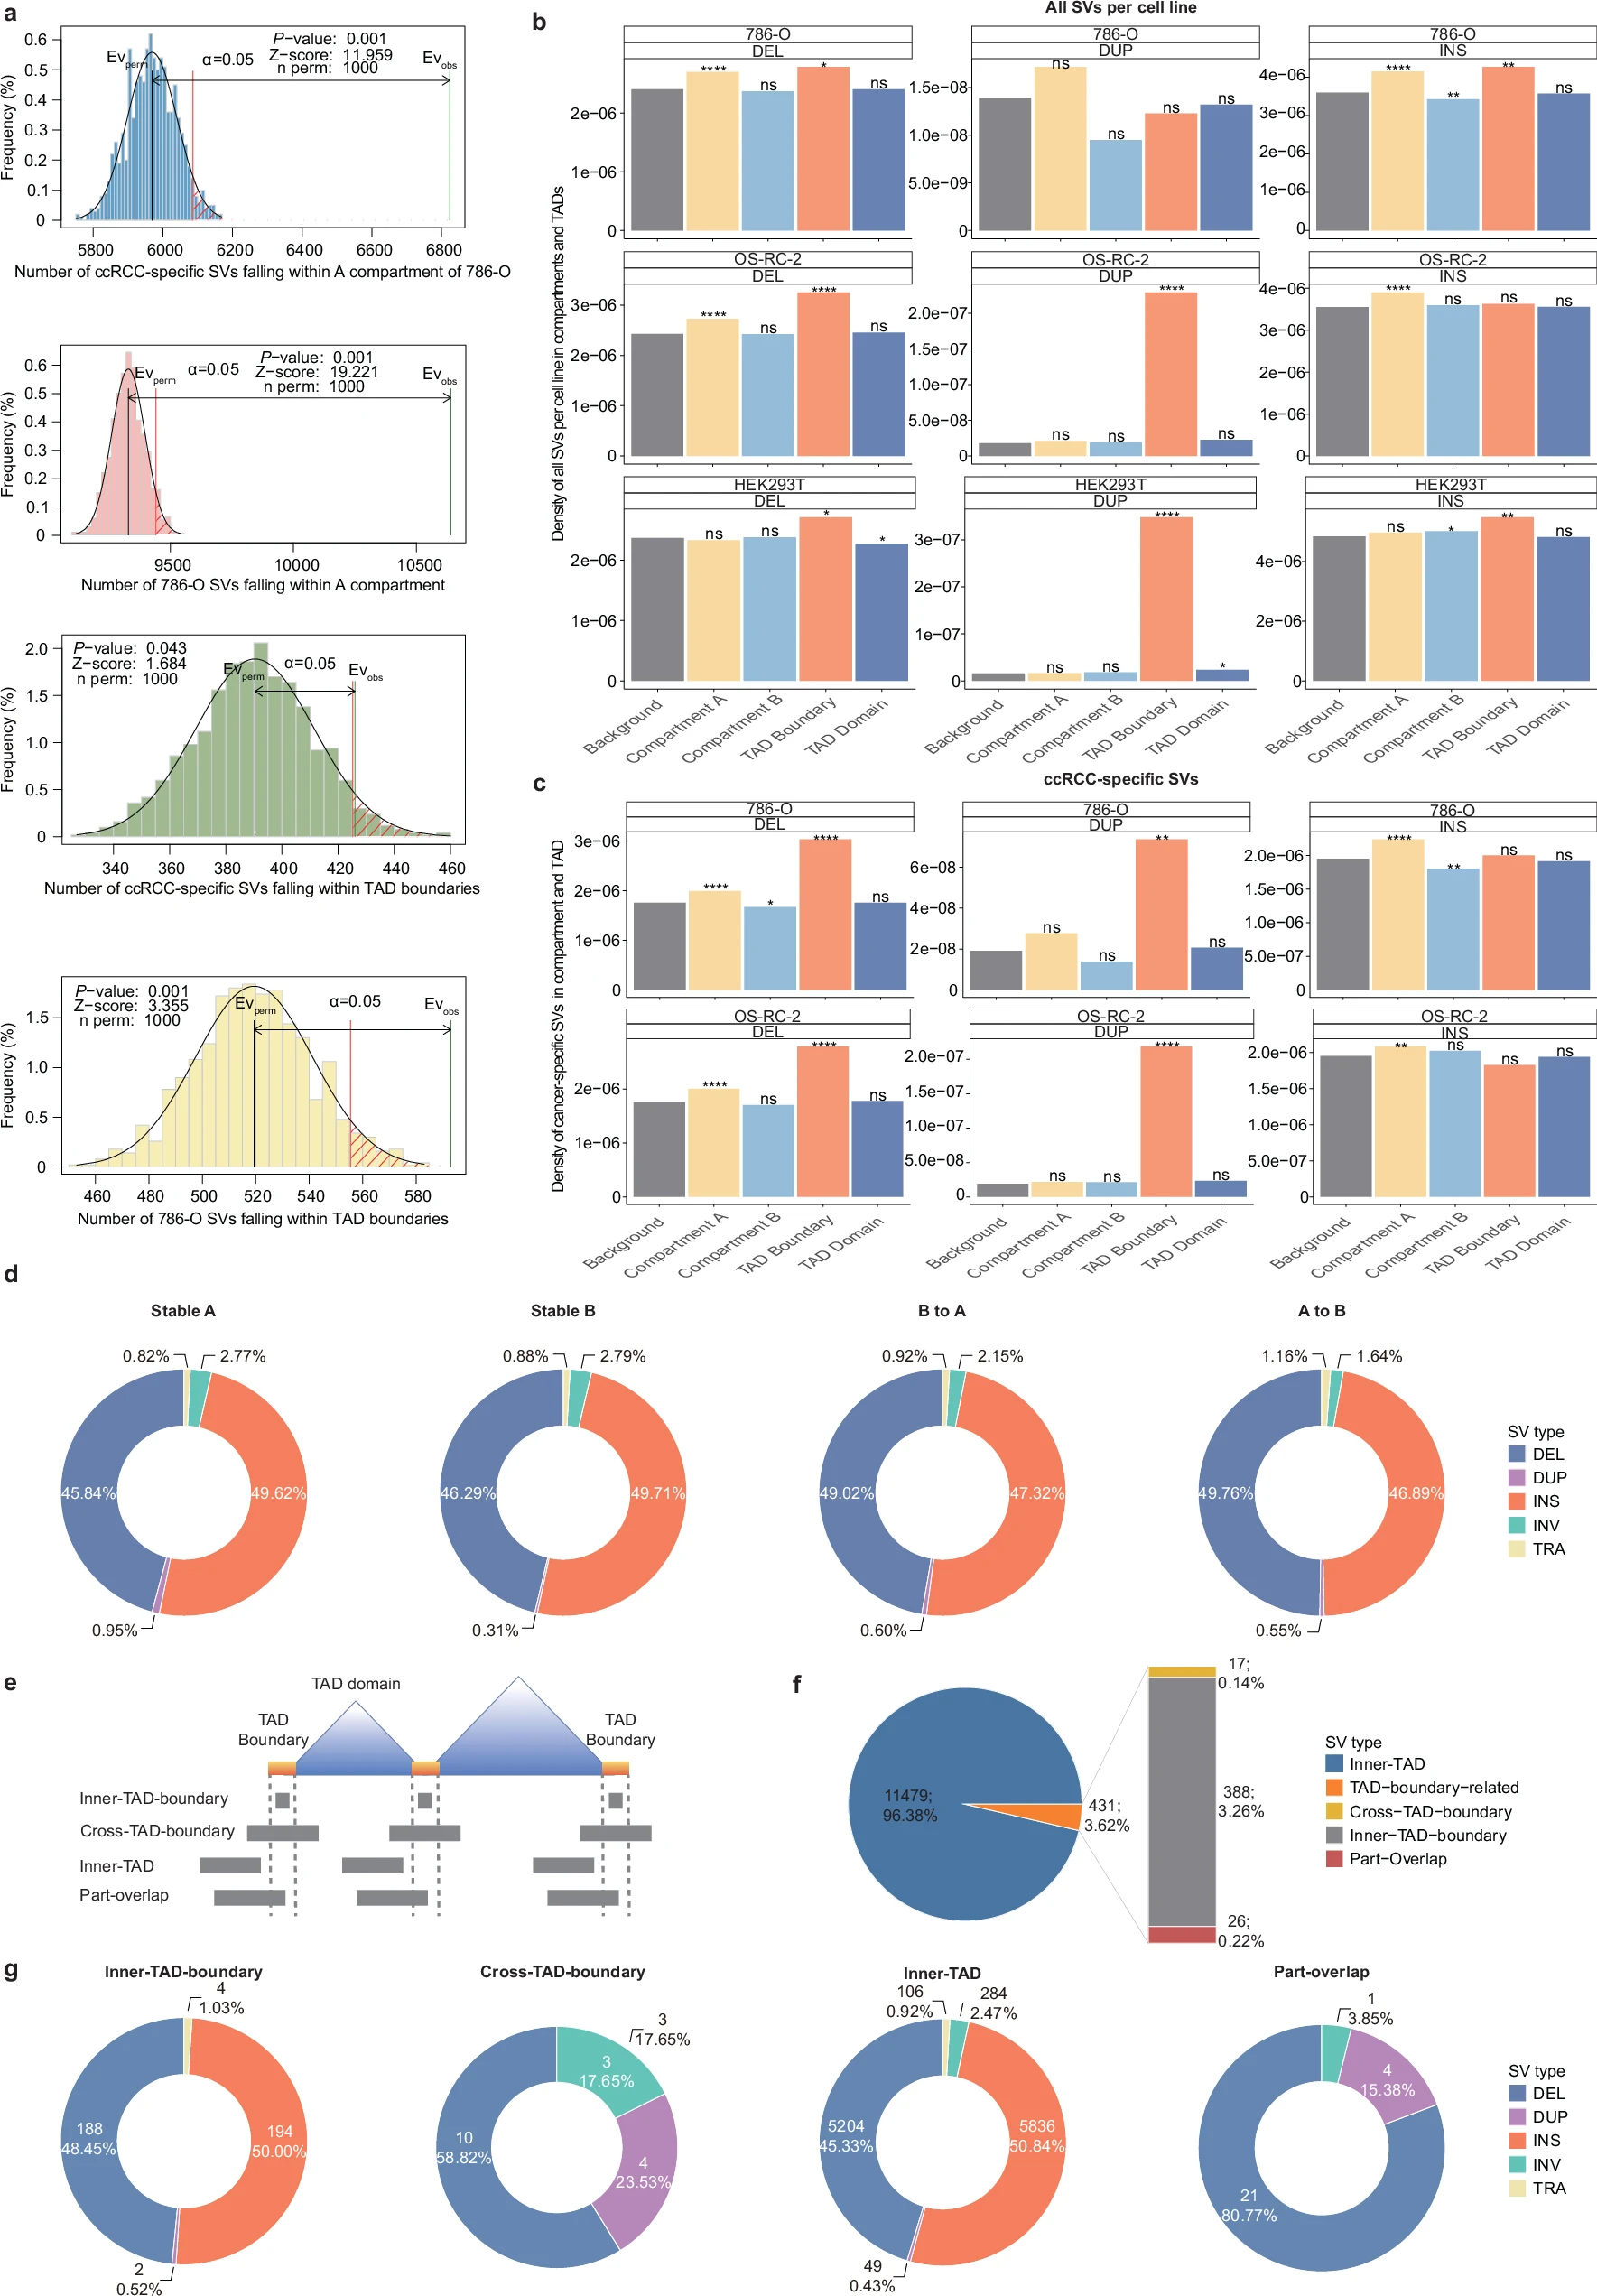
Fig. 3: Distributions of structural variants across 3D genome architectures.
a Permutation testing was employed to assess the spatial distribution patterns of both pan-cellular and ccRCC specific structural variants across 3D chromatin organizations. The Expected distribution was derived from 1000 iterations of random shuffling of chromosomal regions. b Density of SVs (insertions, deletions, and duplications) across A/B compartments and TADs. SV density, calculated as the number of SVs normalized by the length of corresponding chromosomal regions, is represented as follows: gray bars indicate the background SV density across entire chromosomes; yellow bars show SV density in A compartments; light blue bars represent SV density in B compartments; orange bars depict SV density at TAD boundaries; and dark blue bars illustrate SV density within TAD domains. Enrichment analyses were conducted with proportionality test using R’s proportion test, comparing the proportion of SVs in each region of interest to the proportion of that region’s length in the whole genome. Significance levels are denoted as follows: ****p?≤?0.0001, ***p?≤?0.001, **p?≤?0.01, *p?≤?0.05. c Density of ccRCC-specific SVs (insertions, deletions, and duplications) across A/B compartments and TADs. ccRCC-specific SVs are defined as those occurring in 786-O or OS-RC-2 but absent in HEK293T. SV density was calculated using the same method as in the legend of (B). Enrichment analyses for these ccRCC-specific SVs were also performed using R’s proportion test, following the same approach as described in (B). d Proportions of ccRCC specific SV subtypes across distinct A/B compartment switching regions in 786-O cell. e Schematic of SV classification based on the positional relationship between ccRCC specific SV breakpoints and TAD boundaries. f Number and proportion of ccRCC specific SV types in 786-O according to (E). g Number and proportion of ccRCC specific SV types in 786-O according to (E).
3. FAS 细胞为跨器官保守的伤口修复亚群
通过跨数据集分析(糖尿病溃疡、结肠炎模型),证实 FAS 细胞的基因特征在皮肤、肠道等多器官损伤修复中保守,而 CD 瘘管中 FAS 细胞的功能异常具有器官特异性,为克罗恩病瘘管的靶向治疗提供广谱靶点。
四、爱必信 abs131994:精准靶向,筑牢实验核心防线
产品核心信息
| ? 货号: | abs131994 |
| ? 靶点: | DIRAS1(Distinct subgroup of the Ras family member 1) |
| ? 类型: | 兔源多克隆抗体 |
| ? 应用: | 免疫组化(IHC)、免疫荧光(IF)、Western Blot(WB) |
| ? 特异性: | 精准识别人源 DIRAS1 蛋白,无交叉反应。 |
产品在研究中的关键作用
产品优势总结
五、研究意义与应用前景
本研究首次揭示FAS 成纤维细胞亚群及 DIRAS1在克罗恩病瘘管形成中的核心作用,填补了炎症性肠病难治性并发症机制研究的空白;同时,DIRAS1 有望成为克罗恩病瘘管的新型诊断标志物与治疗靶点,为后续靶向药物开发提供方向。
值得关注的是,爱必信 abs131994 抗体作为研究的核心试剂,以媲美进口品牌的性能、更高的性价比,助力国产科研试剂在顶刊研究中占据重要地位,彰显爱必信 “生命科学百宝箱” 的品牌实力。
六、爱必信助力科研,赋能生命科学突破
爱必信(absin)深耕生命科学领域多年,聚焦抗体、试剂盒、小分子化合物、细胞培养试剂等产品研发,为肿瘤、炎症、神经科学等领域研究提供高质量、高性价比的科研工具。
未来,爱必信将持续加码技术创新,优化产品性能,助力更多科研团队突破技术瓶颈,产出更多顶刊成果,赋能中国生命科学研究高质量发展!

- 手机:13761418683