




- 手机:13761418683
联系人:爱必信
网址:http://www.absin.cn/
地 址:上海市浦东新区新浩路58号18号楼

- 基因编辑构建Runx2-brmut/mut分支位点突变小鼠,鉴定基因型、存活率与剪接异常;
- qPCR、数字 PCR、WB 验证突变体 Runx2-II 显著下调、Runx2-I 代偿升高;
- E15.5 胚胎骨骼整体茜素红 / 阿尔新蓝染色,对比膜内、软骨内成骨矿化延迟程度;
- 股骨组织 H-E、番红 O、TRAP(Absin Fast Red Violet LB salt)染色,分析软骨成熟、初级骨小梁、破骨细胞数量;
- 同步对比Runx2-brmut/mut与经典 CCD 模型Runx2+/-新生颅骨、锁骨畸形差异,锁定 Runx2-I 颅骨保护功能;
- 8 周成年小鼠 Micro-CT、动态骨形态计量、三点弯曲力学测试,评估长期骨量与骨骼强度缺陷;
- 成骨分化标记基因定量,结合 BMSC、原代成骨细胞体外诱导,证明 Runx2-II 是成骨分化必需因子;
- EdU 增殖染色证实 Runx2-I 特异性促进颅缝间充质增殖,解释颅骨畸形减轻机制;
- 细胞过表达 / 敲低 + P2 启动子荧光素酶报告,排除 Runx2 自身负反馈,提出 P1/P2 启动子竞争调控模型。
- 分支位点 CGCTAAC 突变为 ACAGTTG 后,Exon1 异常跳接至 Exon3,产生截短无功能 Runx2-II 转录本;
- Runx2-brmut/mut小鼠 E15.5 胚胎、新生颅骨、8 周胫骨中 Runx2-II mRNA 大幅下降,Runx2-I 表达代偿性升高;野生型胚胎 Runx2-II 表达量是 Runx2-I 的 3 倍;
- 纯合突变小鼠约 20% 出生后死亡,存活个体生长期体重低于野生型。
- Runx2-brmut/mut胚胎颅骨、锁骨、肩胛骨、髋骨矿化面积显著降低,膜内成骨延迟;
- 股骨肥大软骨区扩张、初级骨小梁形成受损,软骨成熟标志物 Sox9、Col2a1 上调,提示软骨内成骨阻滞;
- TRAP 染色定量:突变小鼠骨髓内 TRAP 阳性破骨细胞数量显著减少,证明 Runx2-II 缺失间接抑制破骨生成。
- 二者均存在前囟未闭合、鼻骨矿化缺失,但Runx2-brmut/mut锁骨发育缺陷远轻于Runx2+/-;
- 四肢软骨内成骨阻滞程度:Runx2+/- > Runx2-brmut/mut,证明上调的 Runx2-I 可部分代偿软骨内成骨缺陷。
- 突变小鼠骨小梁体积、骨密度、皮质厚度显著下降,骨形成速率(MAR、BFR/BS)全面降低;
- 肱骨最大负荷、刚度下降,骨骼机械强度受损;成年骨缺损程度显著重于经典Runx2+/-小鼠,证明 Runx2-II 维持成年成骨是必需的。
- Runx2-brmut/mut矢状颅缝 EdU 阳性增殖细胞显著增多;
- 生长板软骨、骨小梁成骨细胞增殖无差异,证实 Runx2-I 特异性促进颅缝间充质增殖,弥补 Runx2-II 缺失带来的颅骨发育缺陷。
- Runx2-brmut/mut来源 BMSC ALP 活性、矿化结节几乎消失,Sp7、Bglap 等成骨核心基因大幅下调;
- 原代成骨细胞成熟同样依赖 Runx2-II,Runx2-I 无法单独支撑完整成骨分化。
- 外源过表达 Runx2 不改变内源 Runx2-I/II 水平;敲低 Runx2 不影响 P2 启动子活性;
- Runx2 不存在自身负反馈,突变体 Runx2-I 上调源于 P1、P2 启动子对增强子的竞争性结合。
-
- 破骨细胞特异性显色核心试剂:本研究全部骨组织 TRAP 染色均使用 Absin Fast Red Violet LB salt(abs42018403),可与破骨细胞特征酶 TRAP 的水解产物偶联生成稳定紫红色沉淀,清晰区分多核破骨细胞与其他骨细胞,切片背景干净、显色特异性强,精准定量Runx2-brmut/mut小鼠破骨细胞数量下调趋势;
- 体内骨骼病理定量标准化支撑:适配胚胎、新生、成年小鼠不同阶段股骨石蜡切片,统一染色体系,保障从胚胎到成年骨破骨表型数据可横向对比,为 Runx2 亚型失衡调控骨重建平衡提供直观组织学证据;
- 高分期刊组织学数据合规工具:试剂显色稳定性、重复性满足Frontiers in Cell and Developmental Biology图像定量要求,TRAP 染色结果作为关键表型佐证,支撑「Runx2-II 缺失同时抑制成骨、破骨双向骨代谢」核心推论,是骨骼发育组织学实验不可或缺的显色底物。
《剪接分支位点突变小鼠揭示两种 Runx2 亚型在骨骼发育中的差异化功能》文献深度解析
2026-08-06
一、文献基础综述
(一)期刊基础信息
期刊:Frontiers in Cell and Developmental Biology,2026 年 JCR 一区期刊,2026 最新影响因子 IF=5.3,SCI 收录开放获取期刊;
DOI:10.3389/fcell.2026.1770176;
文章标题:Branch site mutated mice revealed distinct roles of two Runx2 isoforms;
(二)全文核心结论
本研究构建全新 Runx2 分支剪接位点突变小鼠(Runx2-brmut/mut),首次精准分离调控两种 Runx2 亚型(Runx2-I、Runx2-II)的体内功能:Runx2-II 主导成骨细胞分化、骨骼矿化;Runx2-I 特异性调控颅缝间充质细胞增殖,代偿性保护颅骨、锁骨发育;两种亚型存在功能互补,但 Runx2-I 无法完全弥补 Runx2-II 缺失带来的成骨缺陷;同时证实 Runx2 不存在自身转录负反馈调控,P1/P2 双启动子存在竞争性转录互作,为颅骨锁骨发育不全(CCD)、骨质疏松等骨代谢疾病提供全新分子机制与治疗靶点。
(三)Absin 产品作用概括
实验采用 Absin 品牌 Fast Red Violet LB salt (货号abs42018403)完成 TRAP(抗酒石酸酸性磷酸酶)组织染色,特异性标记骨组织内破骨细胞,定量突变小鼠破骨细胞数量变化,直观揭示 Runx2 亚型失衡对破骨生成的间接调控作用;该显色底物保障骨切片酶活性染色清晰、背景低,为骨骼组织学定量数据提供标准化支撑。
二、研究领域背景介绍
Runx2 是调控脊椎动物骨骼发育核心转录因子,直接控制成骨细胞分化、软骨细胞成熟、肥大软骨细胞向成骨转分化;人类RUNX2杂合突变会引发颅骨锁骨发育不全综合征(CCD),小鼠Runx2+/-可模拟 CCD 骨骼畸形表型。 Runx2 存在两种功能亚型:远端 P1 启动子转录 Runx2-II、近端 P2 启动子转录 Runx2-I,二者 N 端氨基酸序列不同,但共享核心 Runt DNA 结合结构域。既往两类 Runx2-II 敲除小鼠模型(Runx2-II-/-、Runx2-IIlacZ/lacZ)骨骼表型矛盾,且无成熟 Runx2-I 特异性敲除动物模型,两种亚型体内特异性生理功能长期存在争议,无法区分二者在膜内成骨、软骨内成骨、破骨平衡中的独立作用;同时 Runx2 双启动子转录调控模式、亚型之间是否存在代偿、是否存在自身反馈调控均缺乏直接体内证据。
基于上述研究空白,本文创新构建剪接分支位点突变小鼠,仅抑制 Runx2-II 成熟 mRNA 合成、同时上调 Runx2-I 表达,在保留两种亚型完整基因组的前提下,实现体内亚型表达分离,系统解析二者在胚胎、新生、成年小鼠骨骼发育中的差异化功能。
三、作者整体递进研究思路总览
全文遵循「新型动物模型构建→亚型表达验证→胚胎骨骼整体表型→组织学软骨 / 成骨 / 破骨分析→新生颅骨锁骨特异性表型对比→8 周成年骨微结构与生物力学→体外间充质 / 原代成骨分化验证→转录调控机制解析」9 层完整逻辑链:
四、分模块详细研究思路、实验结果、对应原文图片
模块 1:分支位点突变小鼠模型构建与亚型表达鉴定
1、研究逻辑:靶向 Intron1 剪接分支位点点突变,破坏 Exon1-Exon2 正常剪接,特异性降低 Runx2-II,同时观察 Runx2-I 表达变化,获得亚型失衡稳定动物模型;
2、核心实验:CRISPR-Cas9 基因编辑、基因测序分型、cDNA 琼脂糖电泳、RT-qPCR、液滴数字 PCR、Western blot;
3、关键结果:
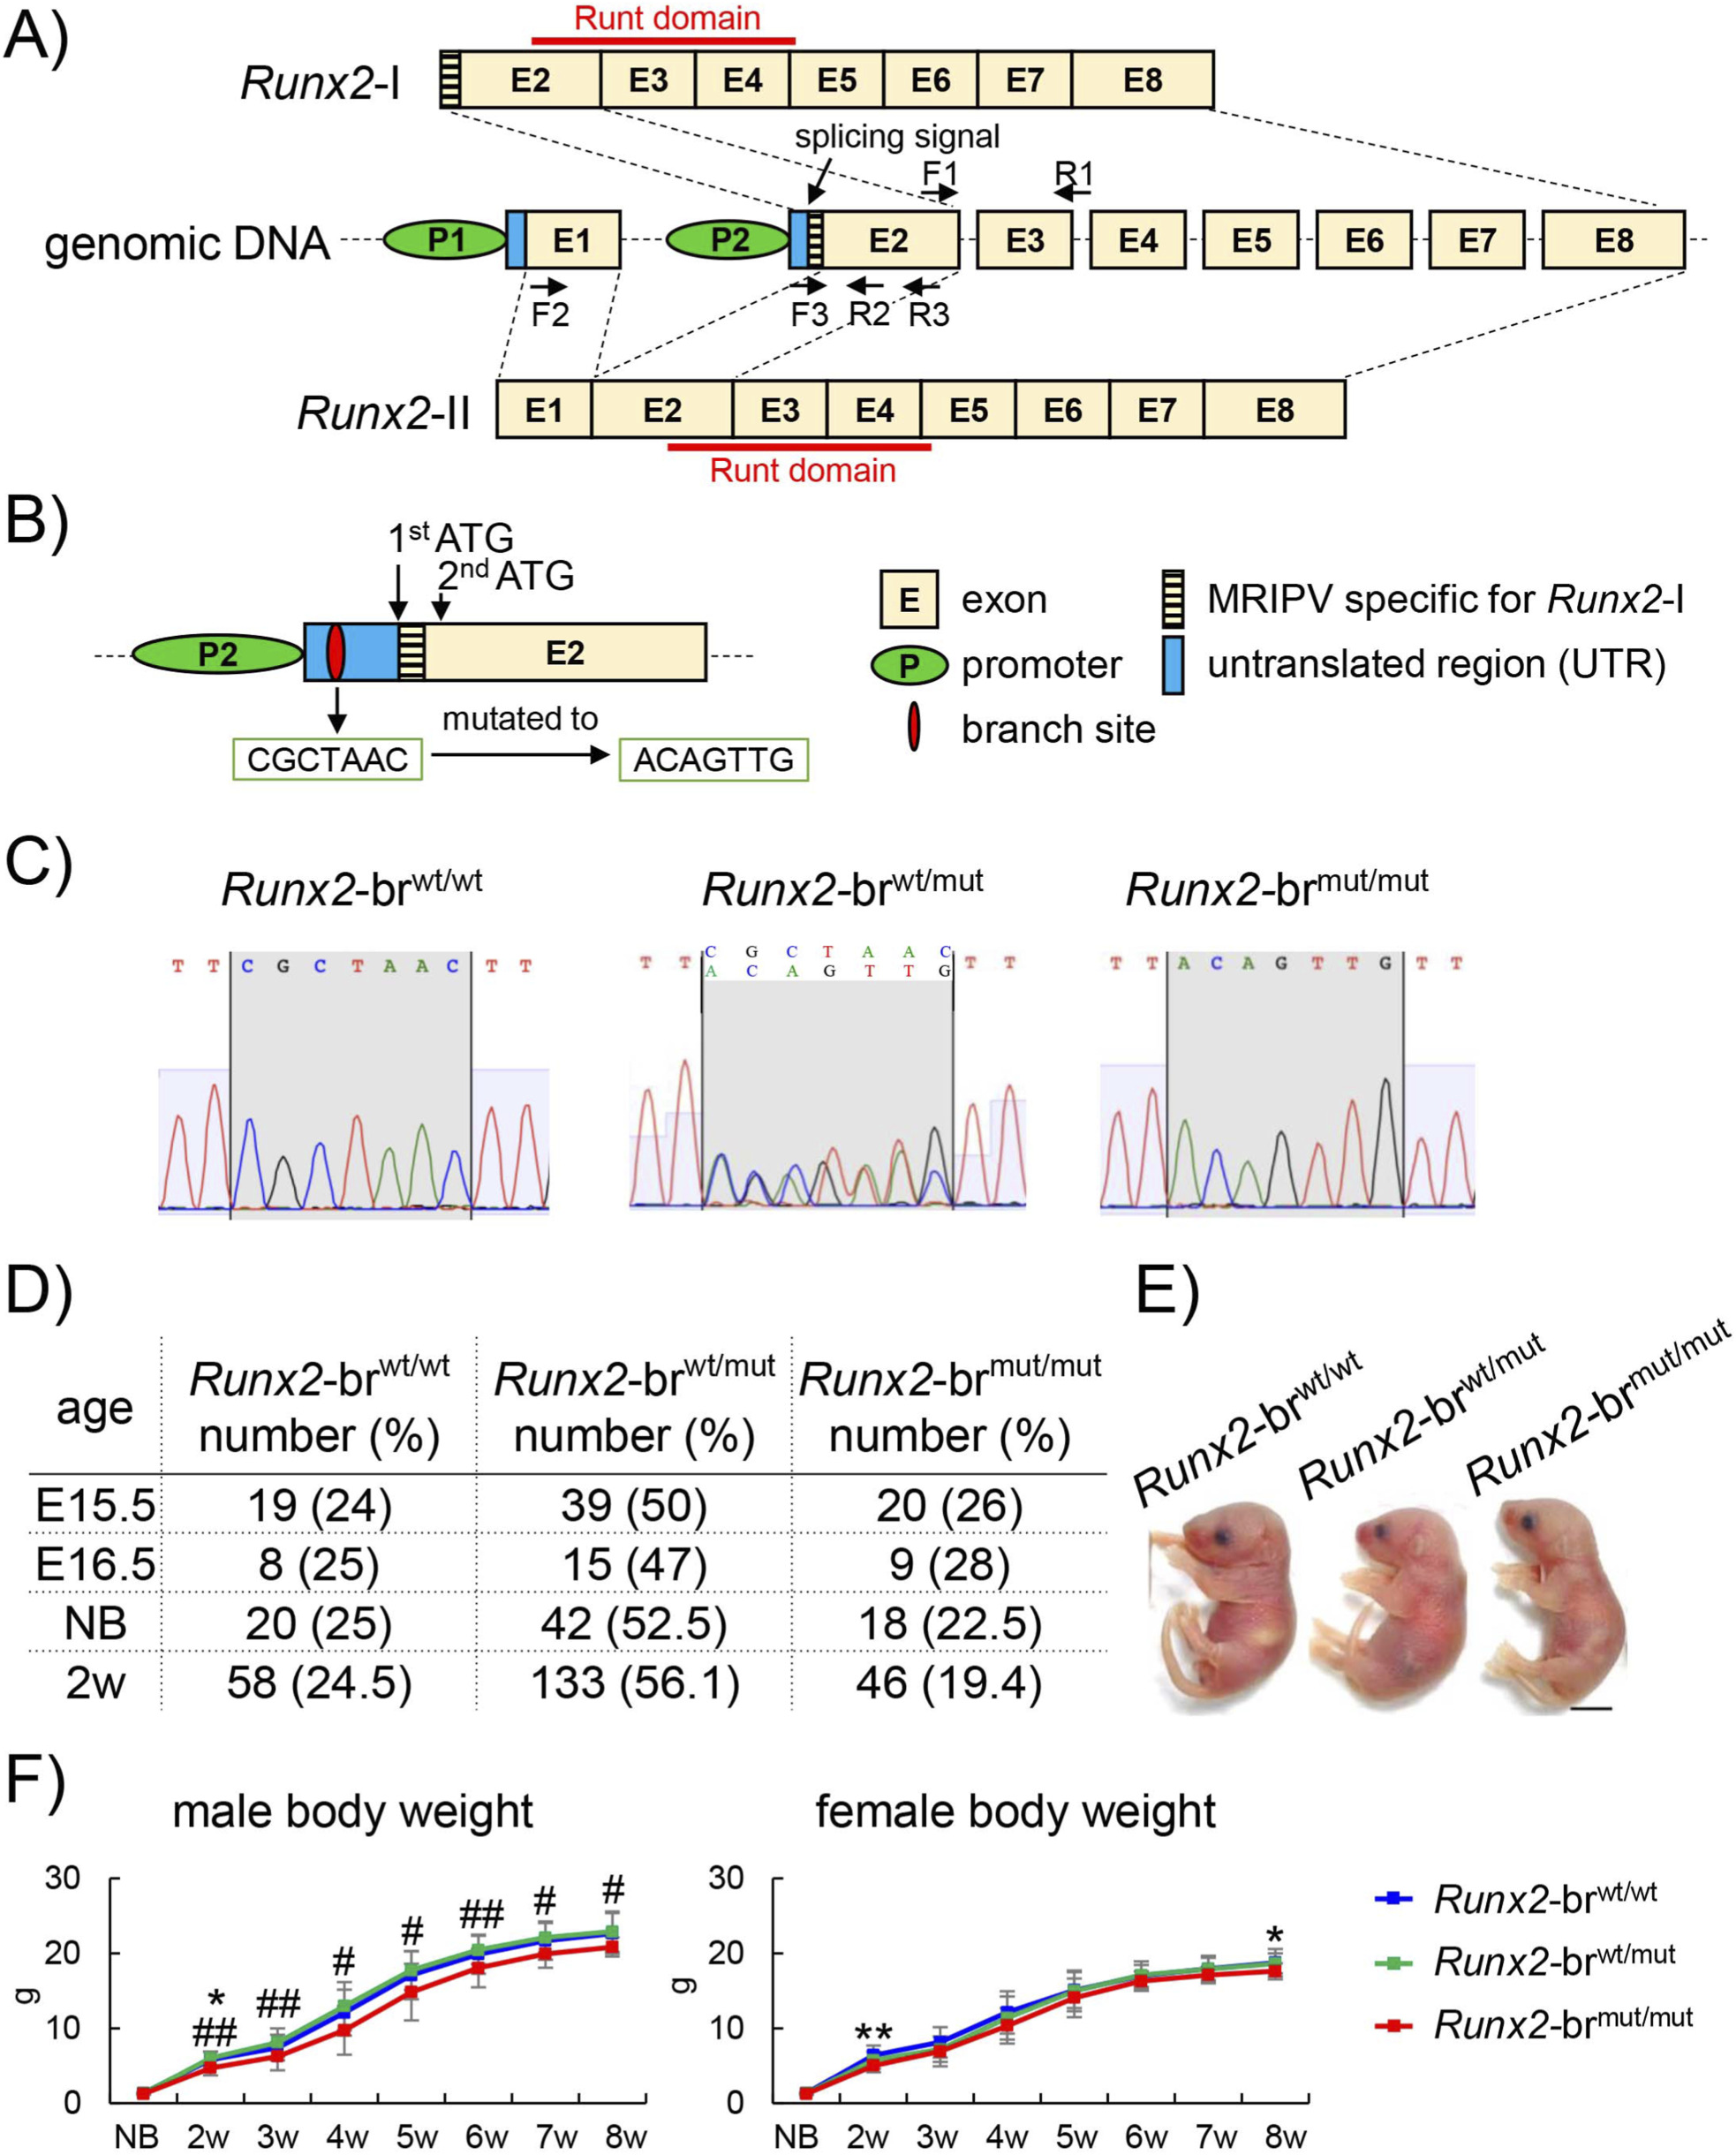
FIGURE 1 Strategies for generating Runx2-brmut/mut mice and genotyping, survival rates, appearance of newborns, and body weights of Runx2-brwt/wt, Runx2- brwt/mut, and Runx2-brmut/mut mice. (A) Schematic presentation of Runx2-I and Runx2-II mRNAs in Runx2-brwt/wt mice and primer designs for amplifying total Runx2 (F1–R1), Runx2-I specific transcripts (F3–R2 and F3–R3), and Runx2-II specific transcripts (F2–R2). (B) Schematic of the construction strategy for Runx2-brmut/mut mice. (C) Genotyping by genome sequencing of Runx2-brwt/wt, Runx2-brwt/mut, and Runx2-brmut/mut mice. (D) Survival rates of Runx2-brwt/wt, Runx2-brwt/mut, and Runx2-brmut/mut mice. (E) Appearance of Runx2-brwt/wt, Runx2-brwt/mut, and Runx2-brmut/mut newborns. Scale bars: 0.5 cm. (F) Body weight curves from newborns (NB) to 8 weeks of age. The number of mice analyzed: newborn, n = 14 (Runx2-brwt/wt), n = 33 (Runx2- brwt/mut), and n = 12 (Runx2-brmut/mut); 2–8 weeks of age, males: n = 16 (Runx2-brwt/wt), n = 33 (Runx2-brwt/mut), and n = 12 (Runx2-brmut/mut); females: n = 21 (Runx2-brwt/wt), n = 40 (Runx2-brwt/mut), and n = 11 (Runx2-brmut/mut). *Versus Runx2-brwt/wt mice, #versus Runx2-brwt/mut mice, *,#p < 0.05, **,##p < 0.01.
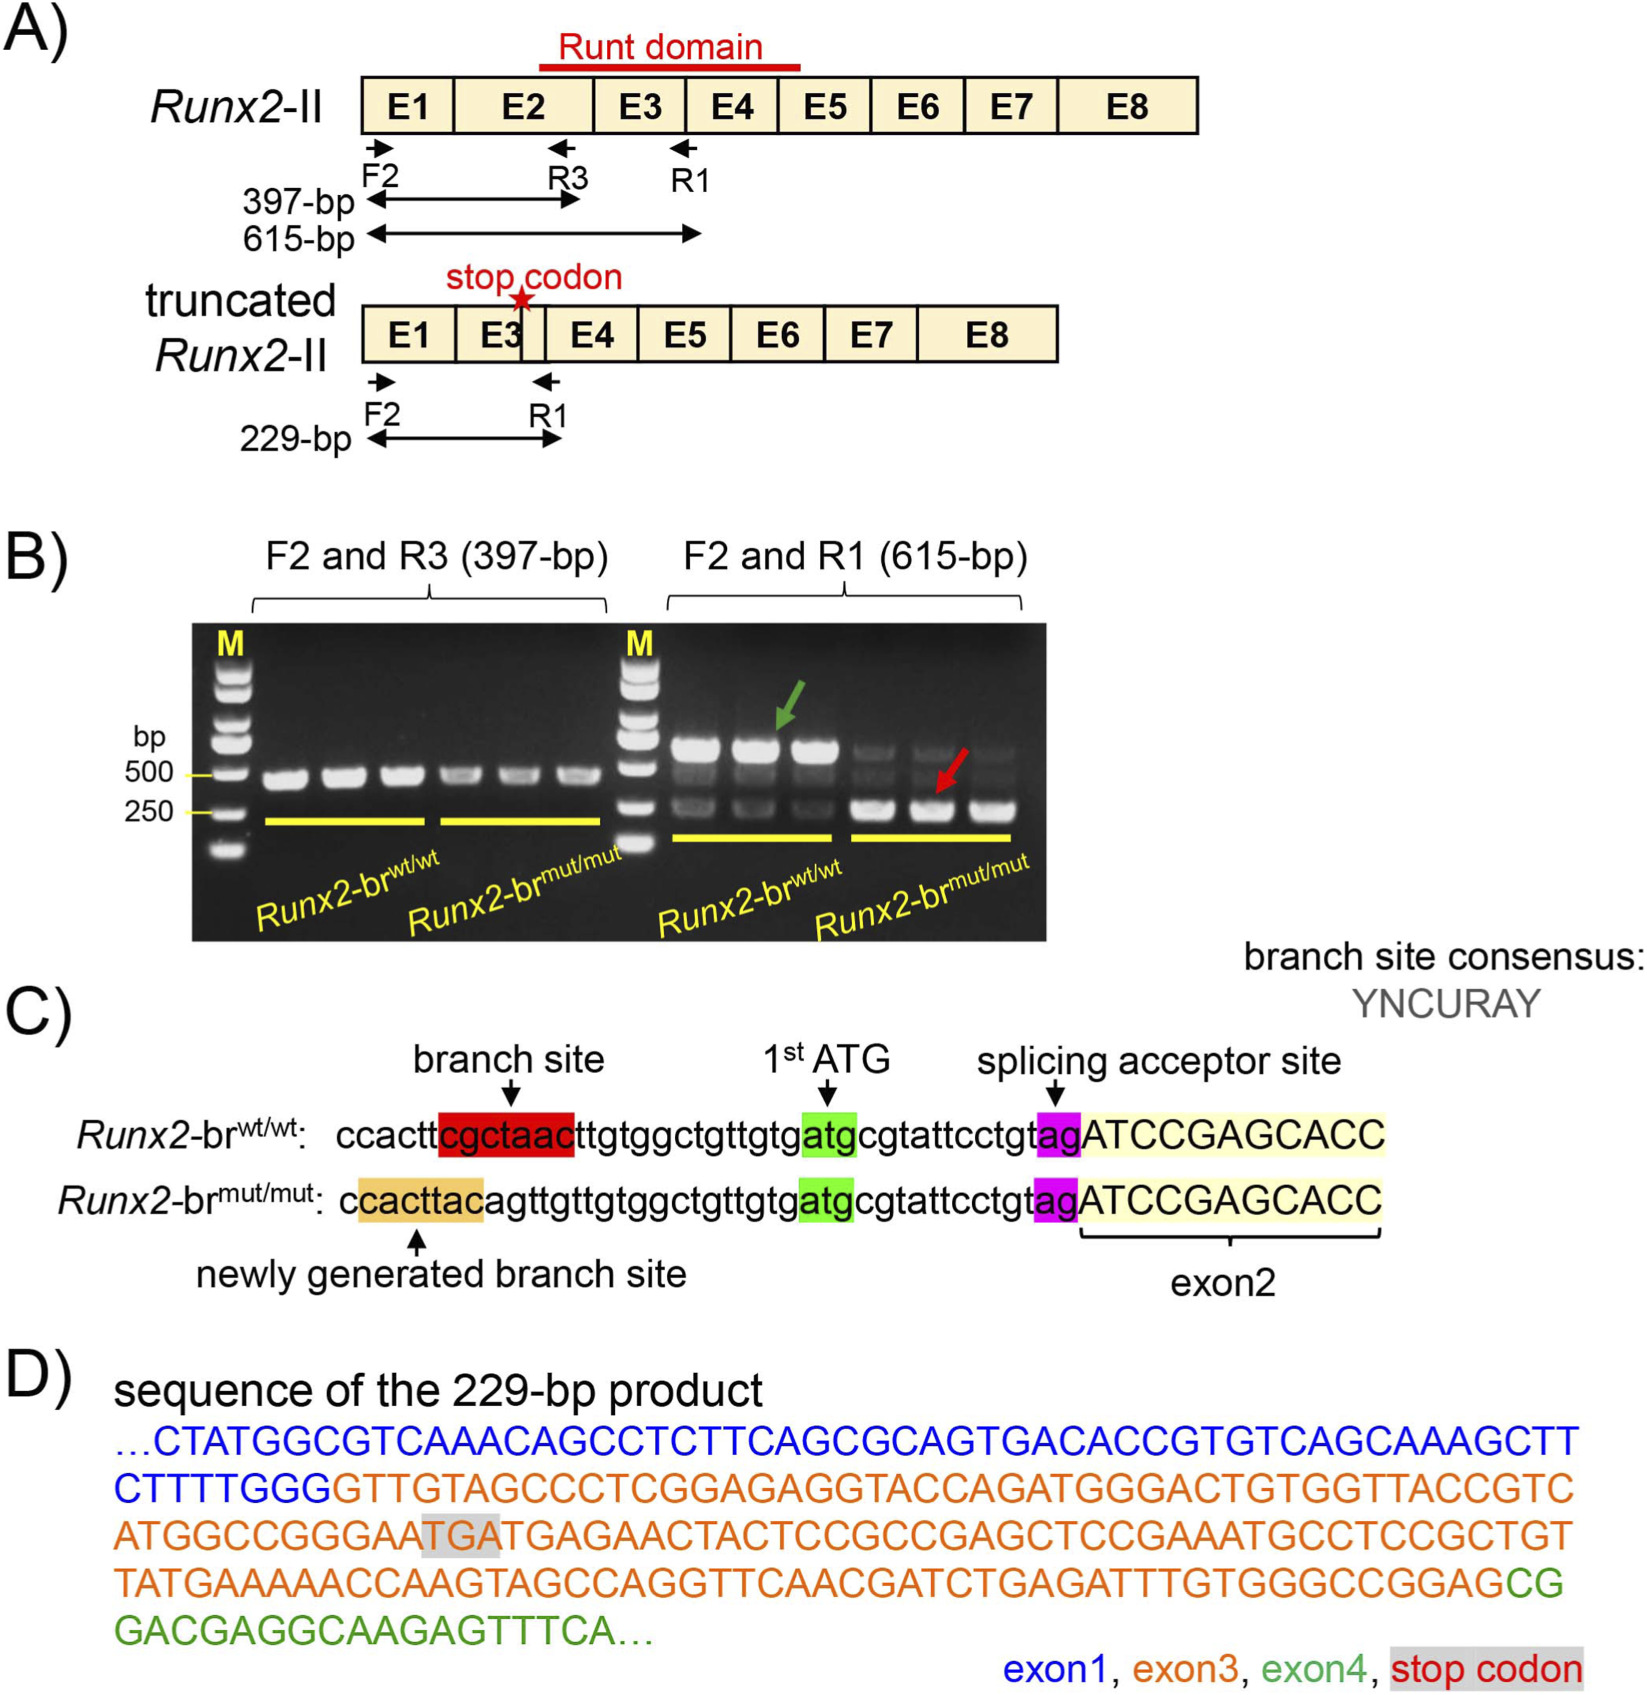
FIGURE 2 Abnormal RNA splicing from exon 1 to exon 3. (A) Schematic representation of wild-type Runx2-II and truncated Runx2-II, the location of the primers, and the expected size of the PCR products. (B) PCR analysis using cDNA from the newborn calvaria of Runx2-brwt/wt and Runx2-brmut/mut mice. A 397-bp product corresponding to Runx2-II was amplified with primers F2 and R3 in both genotypes, but the band intensity in Runx2-brmut/mut mice was lower than that in Runx2-brwt/wt mice. Using primers F2 and R1, a 615-bp product (green arrow) was detected in Runx2brwt/wt mice, whereas a 229- bp product (red arrow) was detected in Runx2-brmut/mut mice. (C) Putative branch site. (D) Sequence of the 229-bp product.
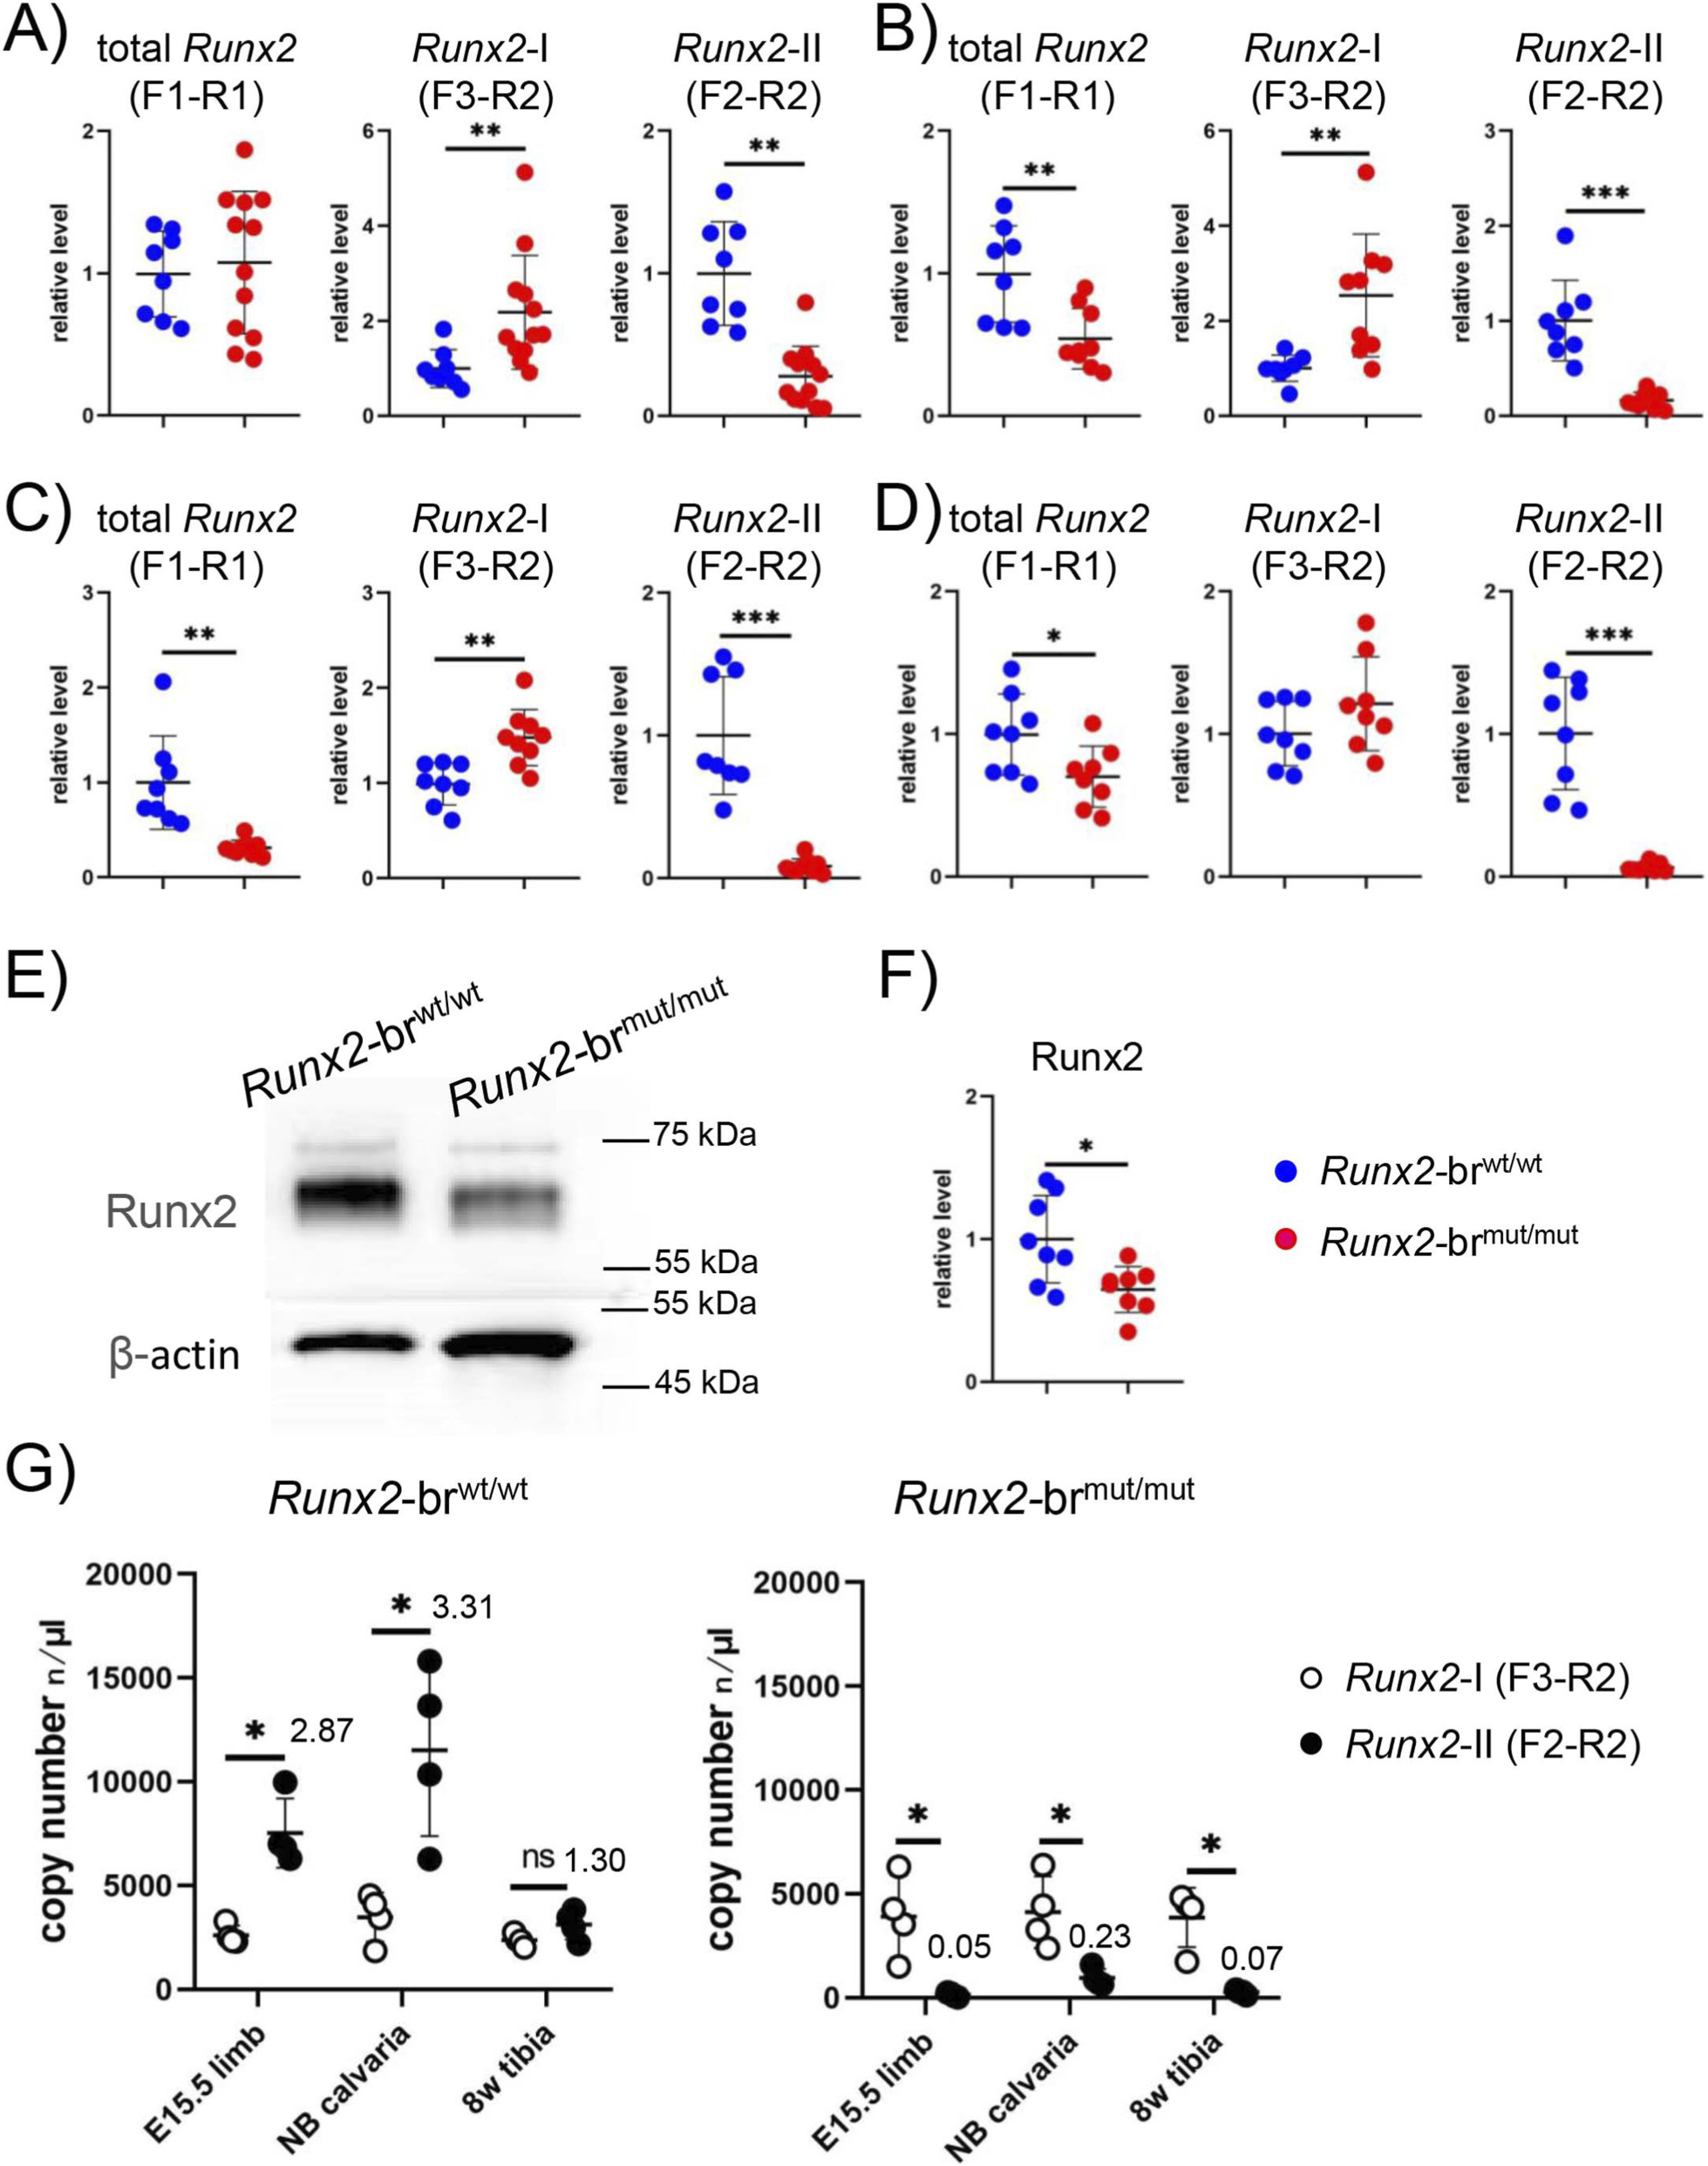
FIGURE 3 The expression of total Runx2, Runx2-I, and Runx2-II in Runx2-brmut/mut mice. (A–D) Real-time RT-PCR analysis of total Runx2, Runx2-I, and Runx2-II using RNA isolated from E15.5 limbs (A) newborn calvaria (B) and limbs (C) and 8-week-old tibiae (D) of Runx2-brwt/wt, Runx2-brwt/mut, and Runx2-brmut/mut mice. The values of Runx2-brwt/wt mice were defined as 1, and the relative levels are shown. The number of mice analyzed: n = 8 (Runx2-brwt/wt) and n = 12 (Runx2-brmut/mut) at E15.5; n = 8 (Runx2-brwt/wt) and n = 9 (Runx2-brmut/mut) at newborn, n = 8 (Runx2-brwt/wt) and n = 8 (Runx2-brmut/mut) at 8 weeks of age. (E,F) Western blot analysis. Proteins were extracted from newborn calvariae, Western blotting was performed using anti-Runx2 antibody, and β- actin was used as an internal control (E). The intensities of bands were normalized against β-actin, normalized values in the average of Runx2-brwt/wt mice were set as 1, and relative levels are shown in (F). The number of mice analyzed was n = 8 (Runx2-brwt/wt) and n = 8 (Runx2-brmut/mut). *Versus Runx2-brwt/wt mice, *p < 0.05, **p < 0.01, ***p < 0.001. (G) Droplet digital RT-PCR analysis of Runx2-I and Runx2-II expression in RNA from E15.5 limbs, newborn calvariae, and 8-week-old tibiae of Runx2-brwt/wt and Runx2-brmut/mut mice. Four mice were analyzed for each tissue. *Versus Runx2-I, *p < 0.05.
模块 2:胚胎期骨骼矿化与股骨组织学分析(含 Absin TRAP 染色实验)
1、研究逻辑:胚胎阶段评估膜内、软骨内成骨整体发育,通过组织染色观察软骨成熟、成骨、破骨细胞数量变化;
2、核心实验:E15.5 胚胎整体骨骼茜素红 - 阿尔新蓝染色、股骨石蜡切片 H-E / 番红 O 染色、TRAP 破骨细胞染色(Absin Fast Red Violet LB salt)、软骨 / 成骨标记 qPCR;
3、Absin 产品使用说明:骨组织切片 TRAP 染色步骤采用 Absin Fast Red Violet LB salt(abs42018403) 作为显色底物,与破骨细胞内抗酒石酸酸性磷酸酶催化产物结合,形成紫红色特异性信号,显微镜下统计 TRAP 阳性破骨细胞数量;
4、关键结果:
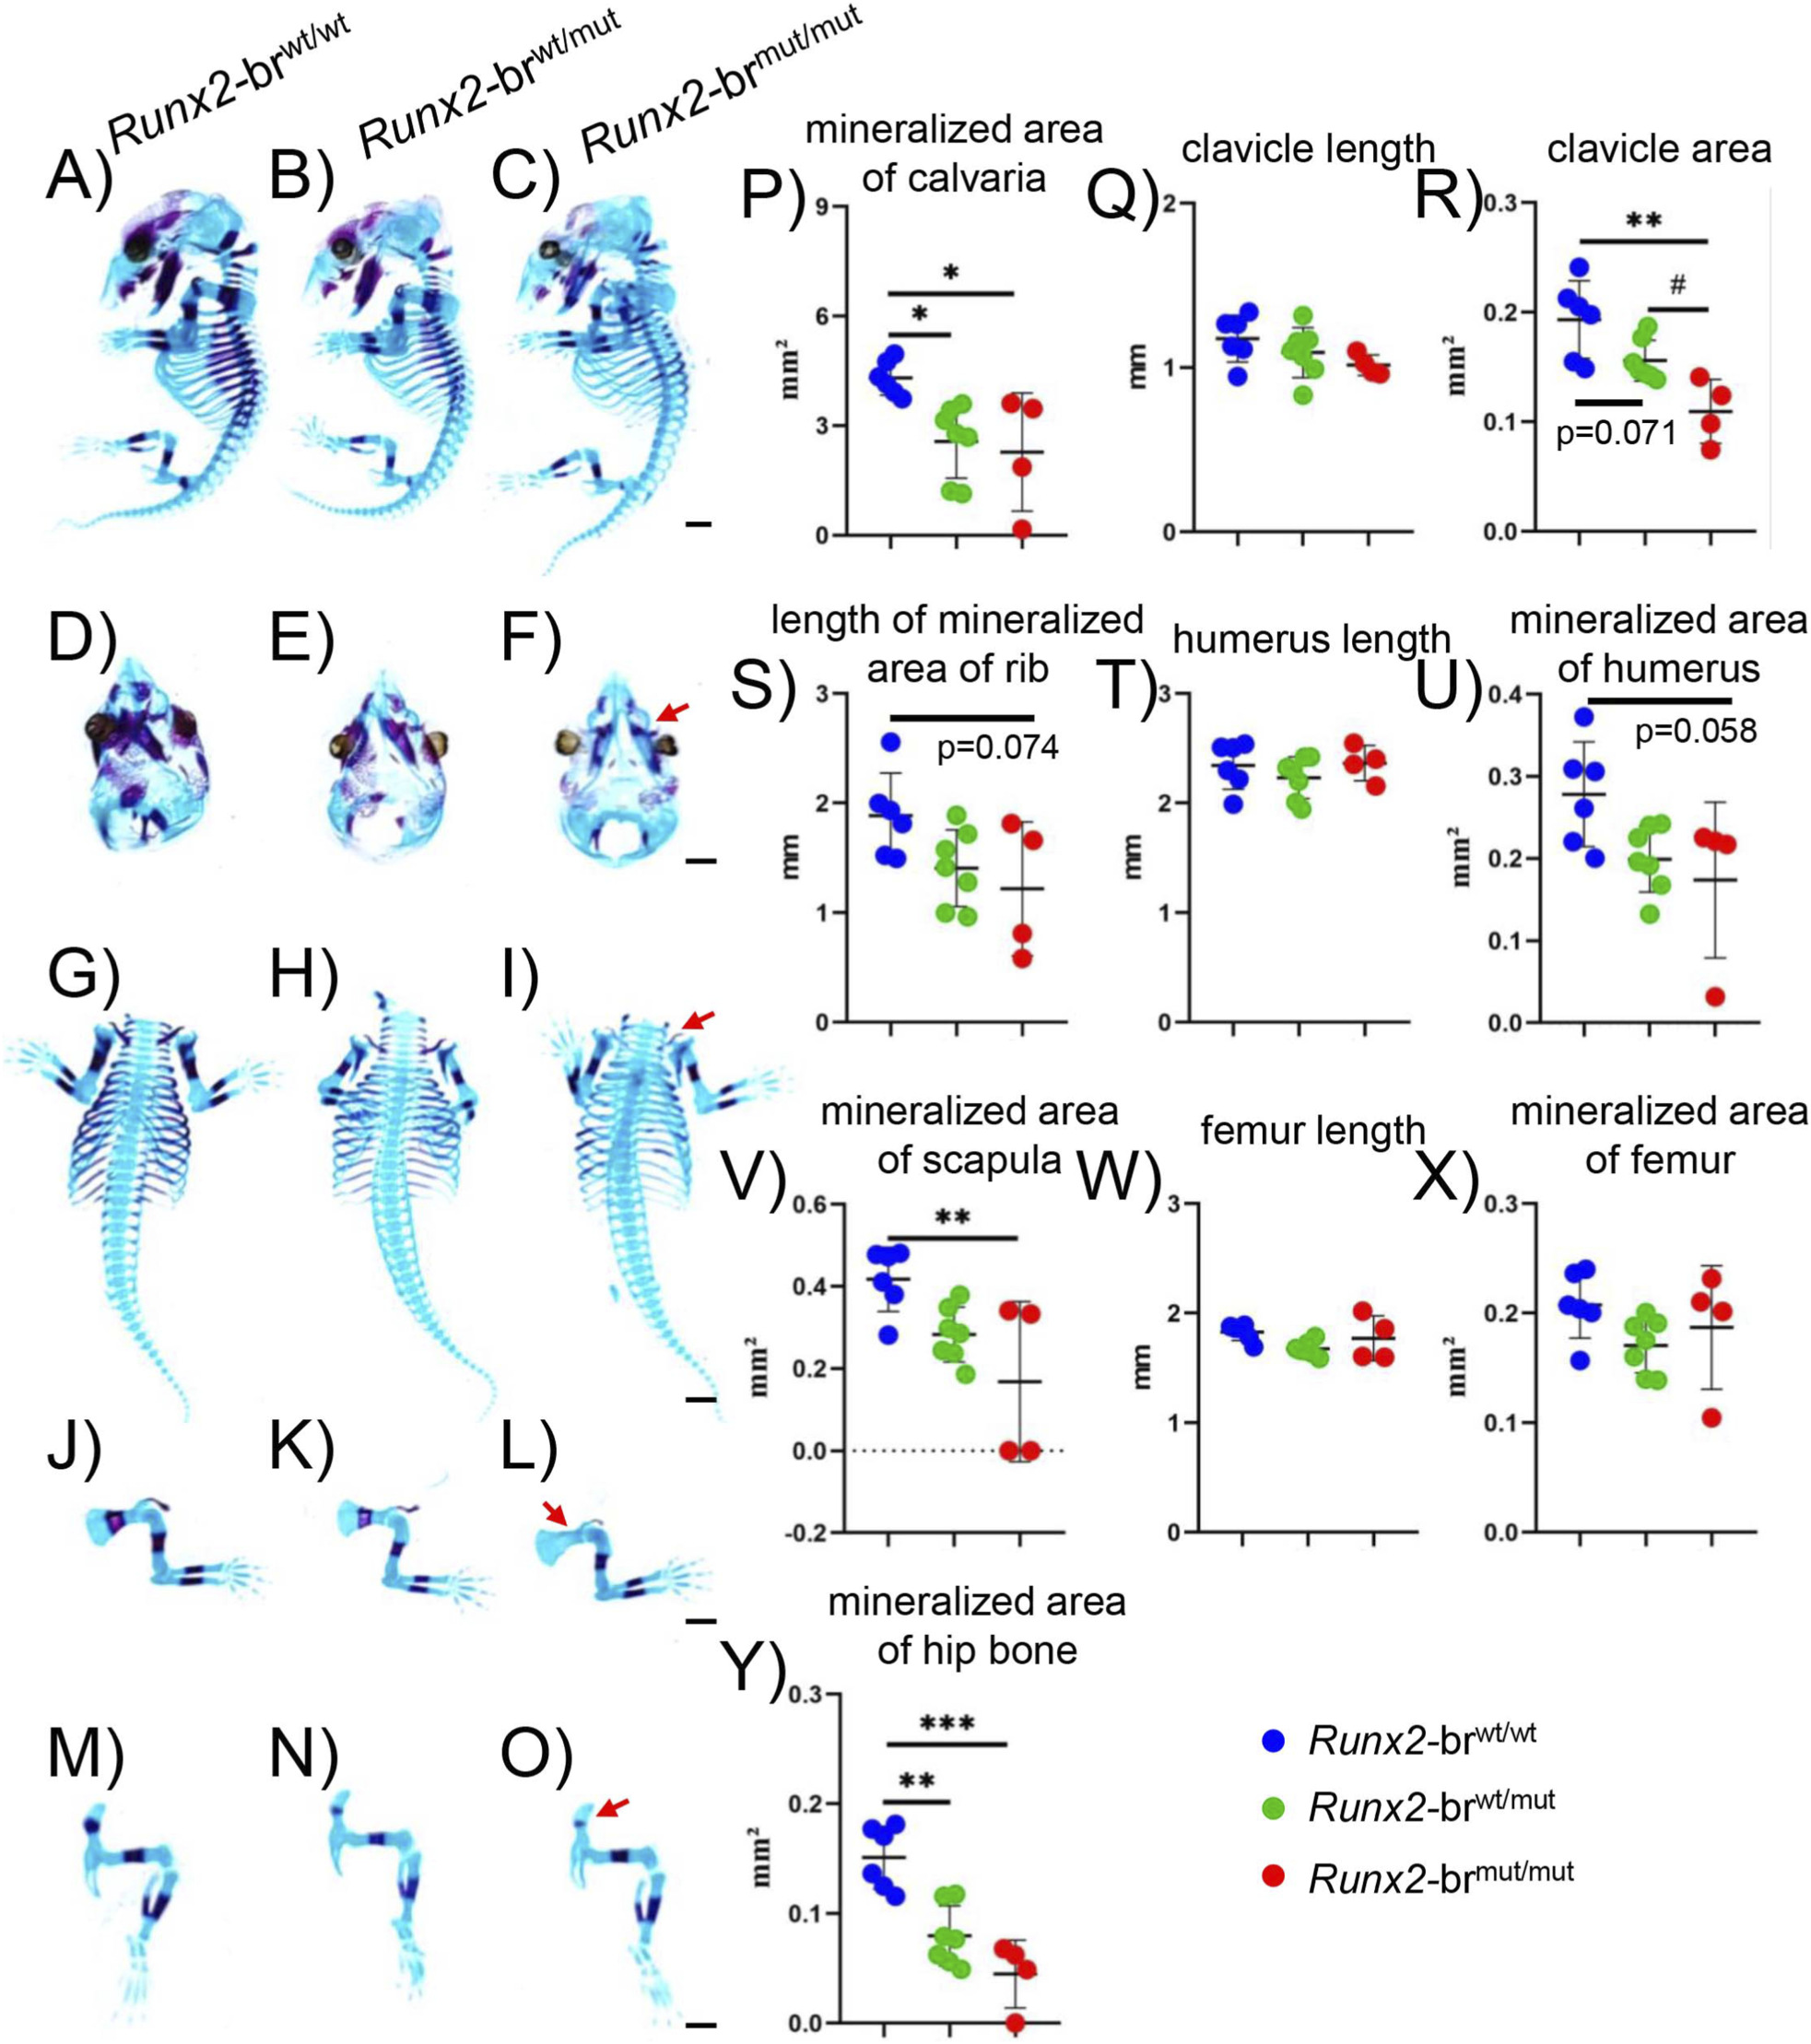
FIGURE 4 Skeletal system of Runx2-brmut/mut embryos at E15.5. (A–O) Lateral view of whole skeletons (A–C) top view of skulls (D–F) clavicle, ribs, and vertebrae (G–I) forelimbs (J–L) and hindlimbs (M–O) in Runx2-brwt/wt, Runx2-brwt/mut, and Runx2-brmut/mut mice. Red arrows in (F,I,L,O) indicate less mineralized frontal bone, clavicle, scapula, and hip bone, respectively, in Runx2-brmut/mut mice. Scale bars: 1 mm. (P–Y) Quantification of skeletal parameters: mineralized area of calvariae (P) clavicle length (Q) clavicle area (R) length of mineralized area of ribs (S) humerus length (T) mineralized area of humeri (U) mineralized area of scapulae (V) femur length (W) mineralized area of femurs (X) and mineralized area of hip bones (Y) in Runx2-brwt/wt, Runx2- brwt/mut, and Runx2-brmut/mut mice. The number of mice analyzed, n = 6 (Runx2-brwt/wt), n = 7 (Runx2-brwt/mut), and n = 4 (Runx2-brmut/mut). *Versus Runx2- brwt/wt mice, #Versus Runx2-brwt/mut mice, *,#p < 0.05, **p < 0.01, ***p < 0.001.
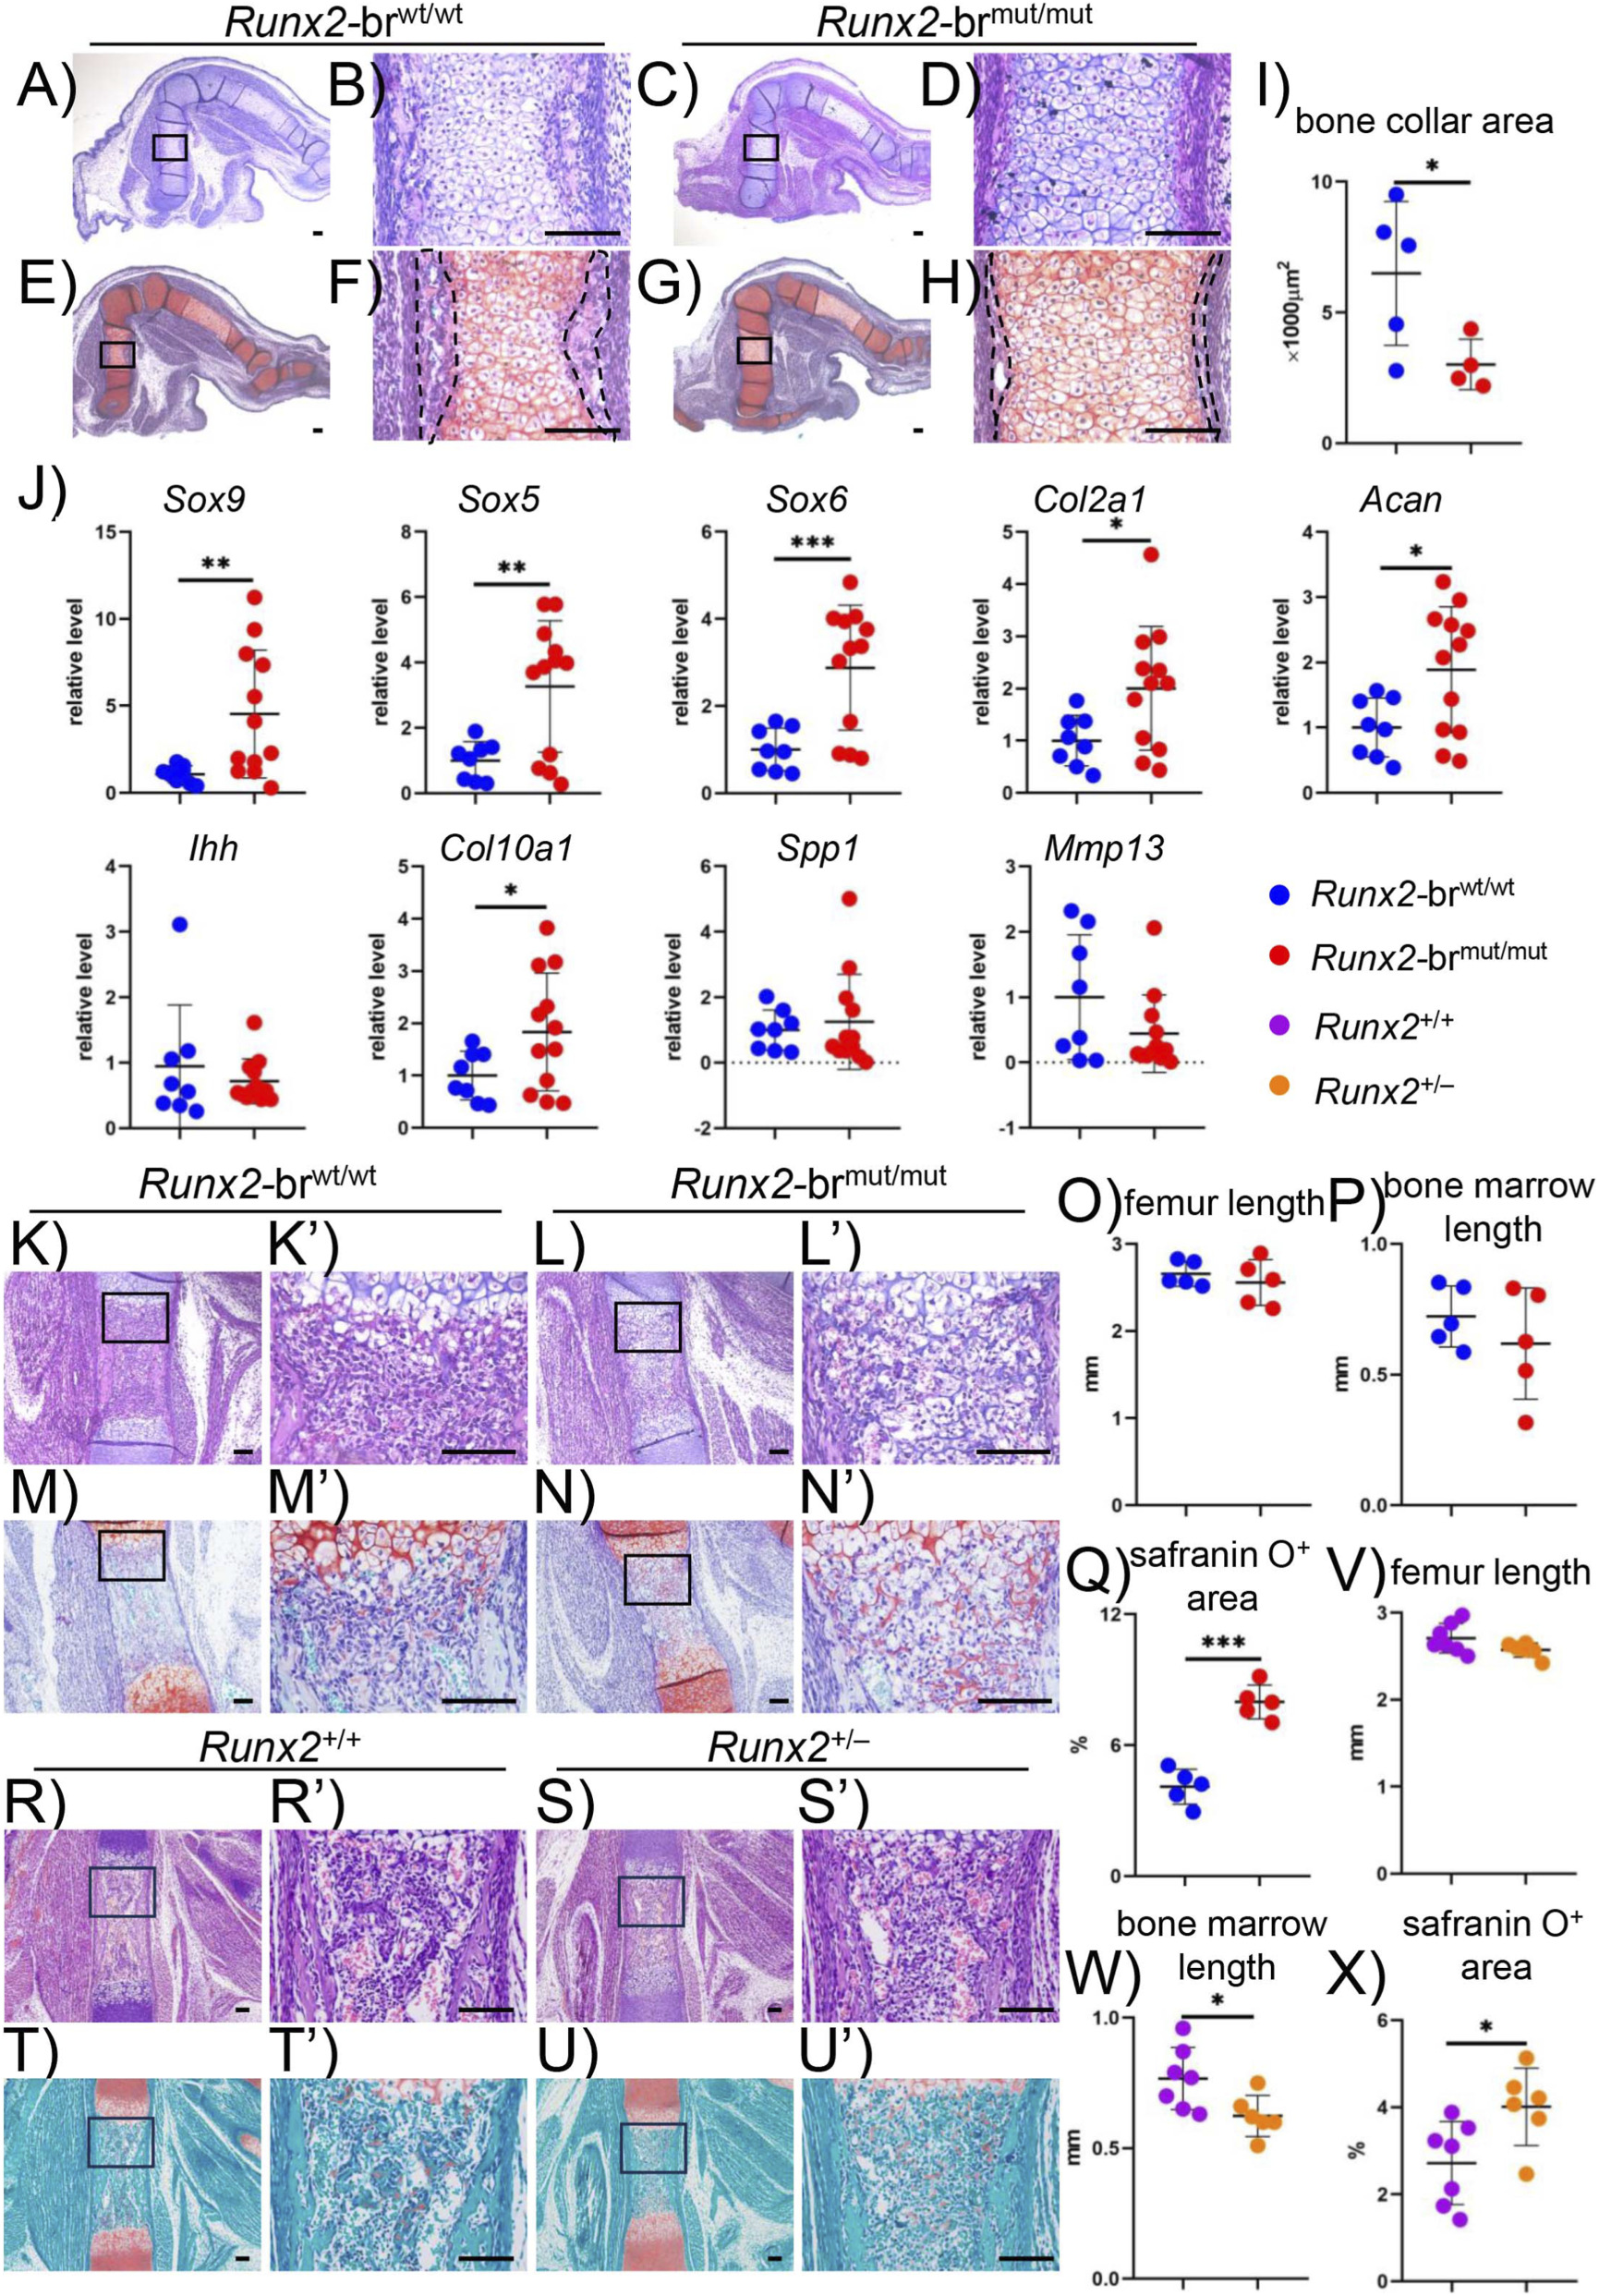
FIGURE 5 Histological analyses of Runx2-brwt/wt, Runx2-brmut/mut, Runx2+/+, and Runx2+/? embryos and real-time RT-PCR analysis of chondrocyte differentiation markers. (A–I) H-E staining (A–D) and Safranin O staining (E–H) of femoral sections from Runx2-brwt/wt and Runx2-brmut/mut embryos at E15.5. The boxed regions are magnified in the right column. Scale bars: 0.1 mm. The bone collar area was measured in (F,H) and quantitative data are shown in (I). The number of mice analyzed was n = 5 (Runx2-brwt/wt) and n = 4 (Runx2-brmut/mut). (J) Real-time RT-PCR analysis of RNA extracted from hindlimb skeletons of Runx2-brwt/wt and Runx2-brmut/mut embryos at E15.5. The values in Runx2-brwt/wt mice were defined as 1, and the relative levels are shown. The number of mice analyzed: n = 8 (Runx2-brwt/wt) and n = 12 (Runx2-brmut/mut). (K–X) H-E (K,L,R,S) and Safranin O (M,N,T,U) staining, femur length (O,V) bone marrow length (P,W) and percentage of safranin O-positive area in the bone marrow (Q,X) in the femoral sections of Runx2-brwt/wt and Runx2-brmut/mut mice (K–Q) and Runx2+/+ and Runx2+/? mice (R–X) at E16.5. Scale bars: 0.1 mm. The number of mice analyzed: n = 5 (Runx2-brwt/wt) and n = 5 (Runx2-brmut/mut); n = 7 (Runx2+/+) and n = 6 (Runx2+/?). *Versus Runx2-brwt/wt mice or Runx2+/+ mice, *p < 0.05, **p < 0.01, ***p < 0.001.
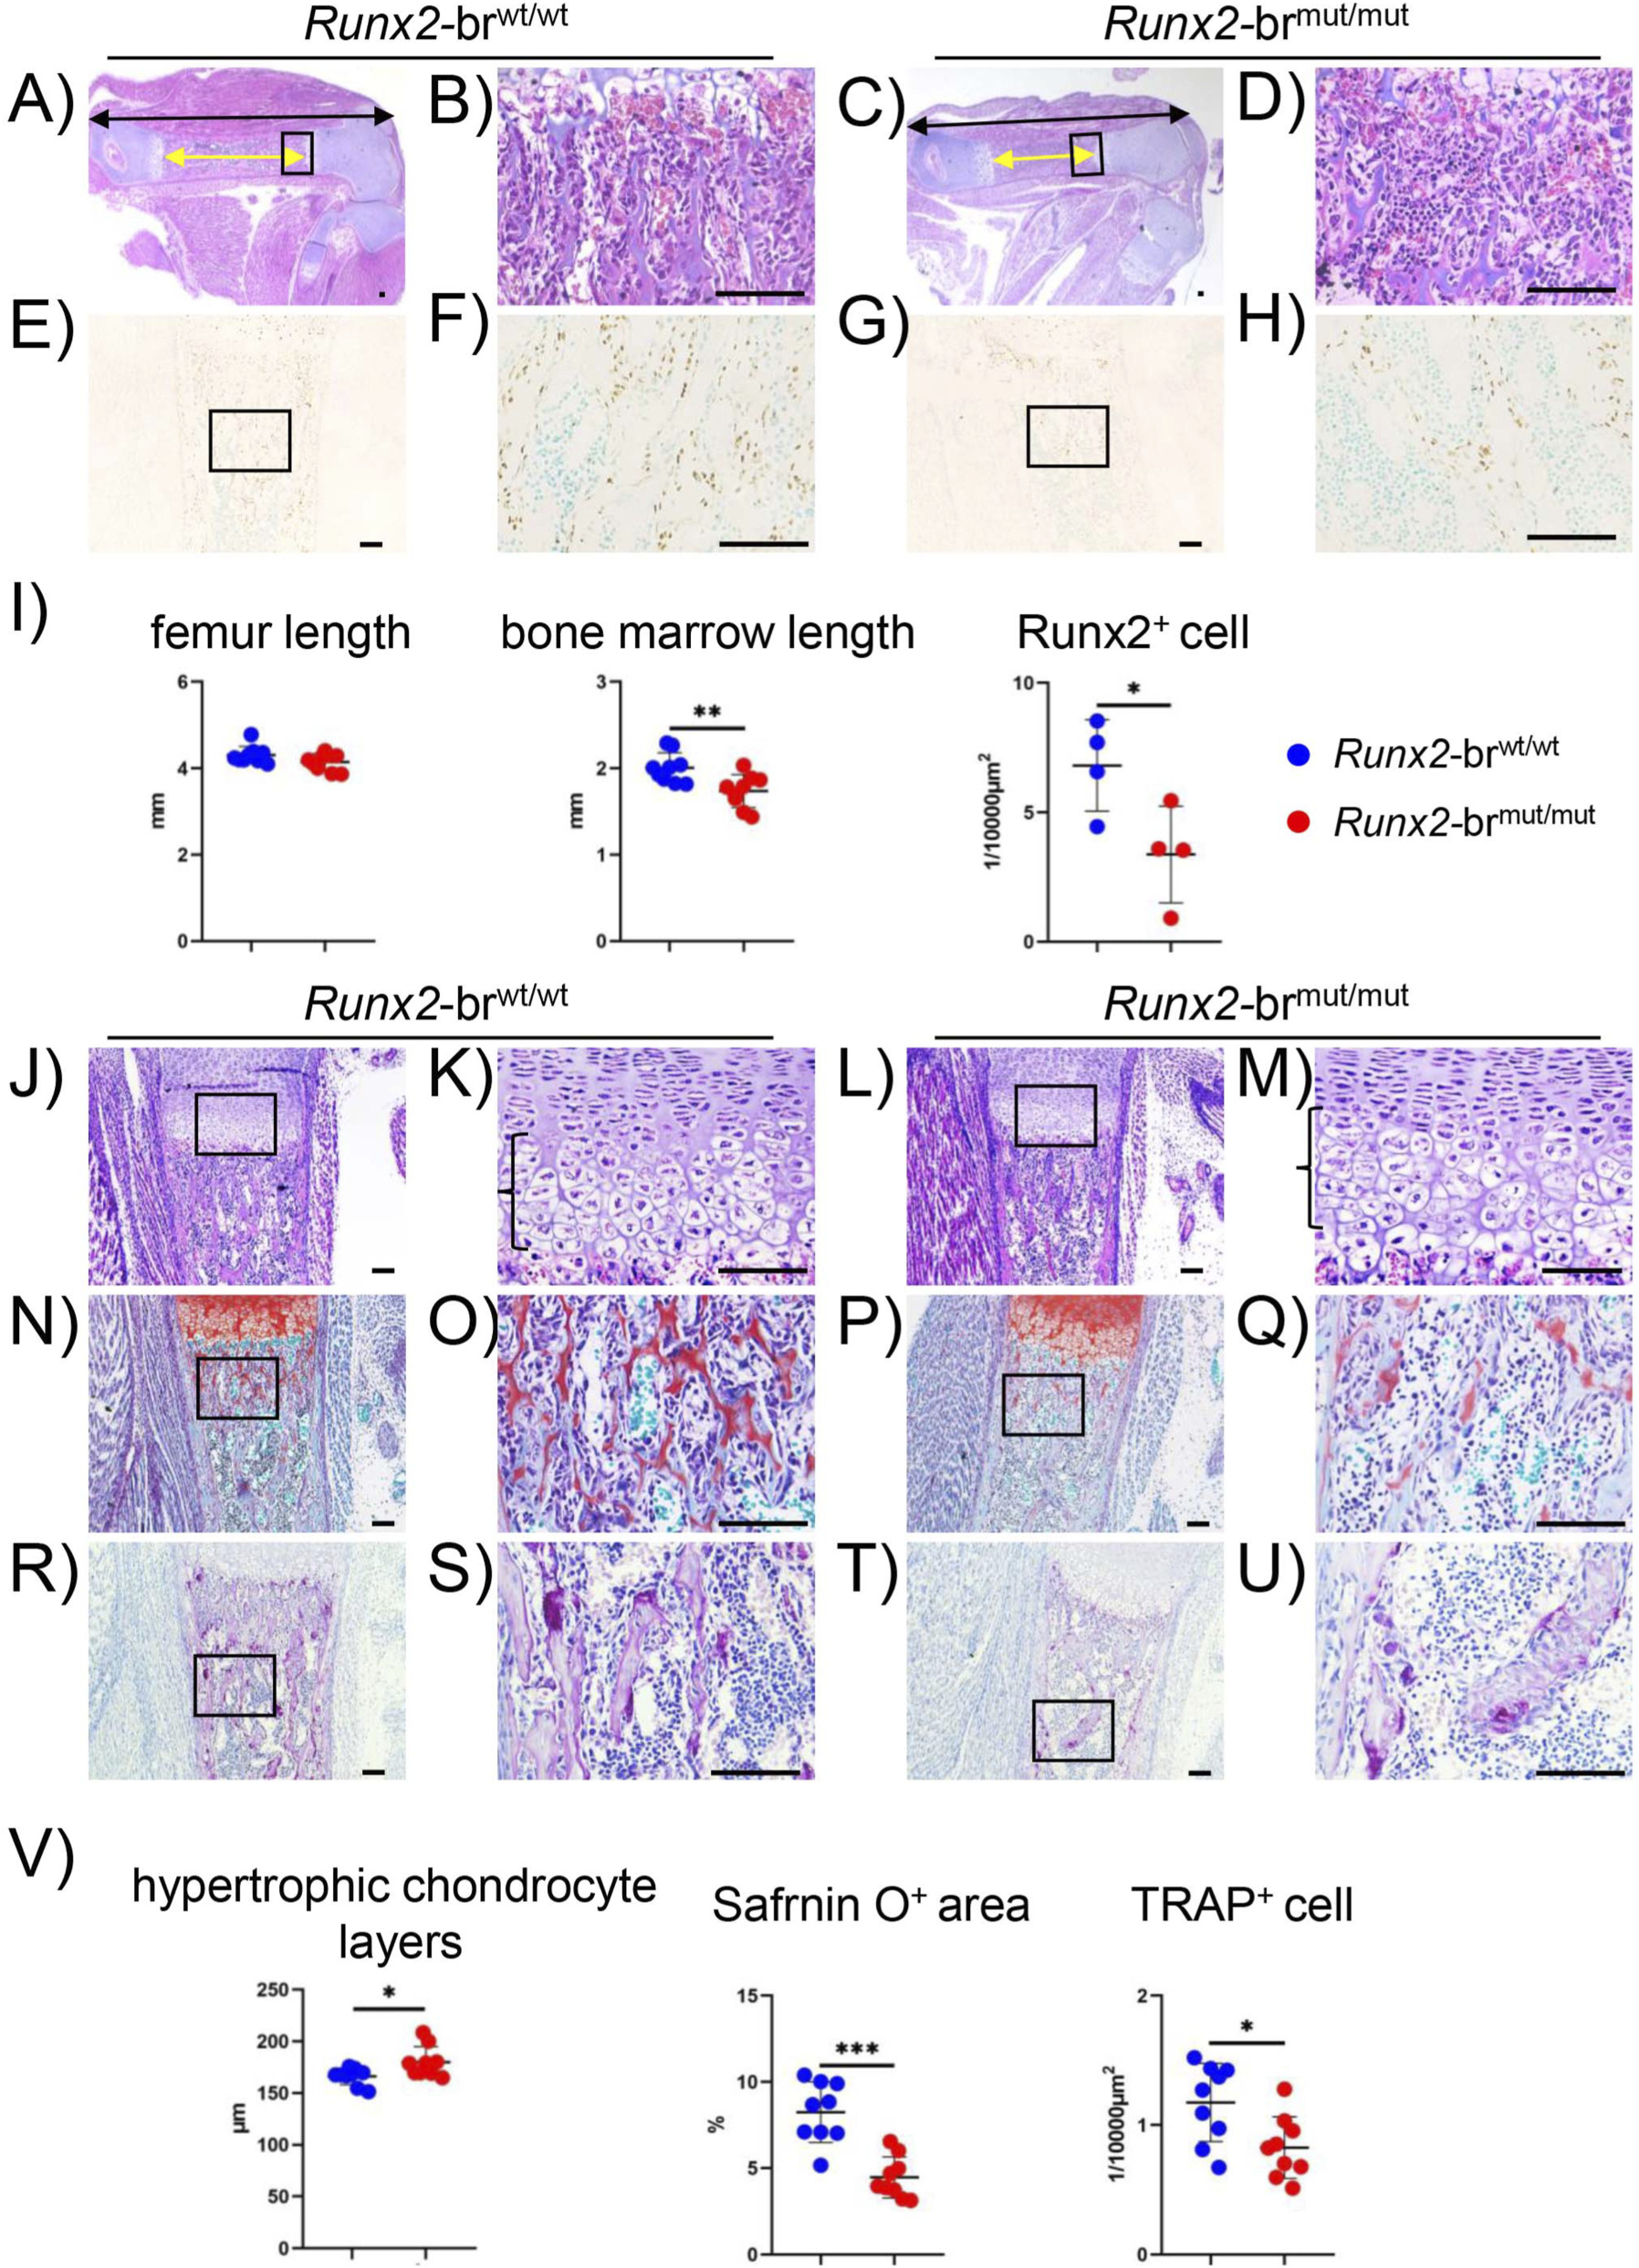
FIGURE 7 Histological analysis of Runx2-brwt/wt and Runx2-brmut/mut newborns. (A–H) H-E staining (A–D) and immunohistochemical analysis using anti-Runx2 antibody (E–H) of femoral sections from Runx2-brwt/wt and Runx2-brmut/mut mice. The boxed regions are magnified in the right column. Scale bars: 0.1 mm. (I) Quantification of femur length, black bidirectional arrow line in (A,C), length of bone marrow, yellow bidirectional arrow line in (A,C) and Runx2-positive cells in the primary spongiosa. The number of mice analyzed: n = 9 in H-E staining, n = 4 in Runx2 immunostaining. *Versus Runx2+/+ or Runx2-brwt/wt mice, #Versus Runx2-brwt/mut mice. *,#p < 0.05, **p < 0.01, ***p < 0.001. (J–M) H-E staining. (N–Q) Safranin O staining. (R–U) TRAP staining. The boxed regions are magnified in the right column. Scale bars: 0.1 mm. (V) The lengths of the hypertrophic chondrocyte layers are shown in (K,M) the percentages of Safranin O-positive area in the bone marrow were measured using (O,Q) and the number of TRAP-positive cells in the bone marrow was counted using (S,U). Nine mice were analyzed for each genotype. *Versus Runx2-brwt/wt mice, *p < 0.05, ***p < 0.001.
模块 3:新生小鼠与 CCD 模型(Runx2+/-)骨骼表型对比
1、研究逻辑:平行对比两种 CCD 相关模型,区分 Runx2 总量降低、Runx2-II 特异性缺失带来的骨骼畸形差异,挖掘 Runx2-I 颅骨保护功能;
2、核心实验:新生小鼠整体骨骼染色、颅缝、锁骨、四肢骨定量;
3、关键结果:
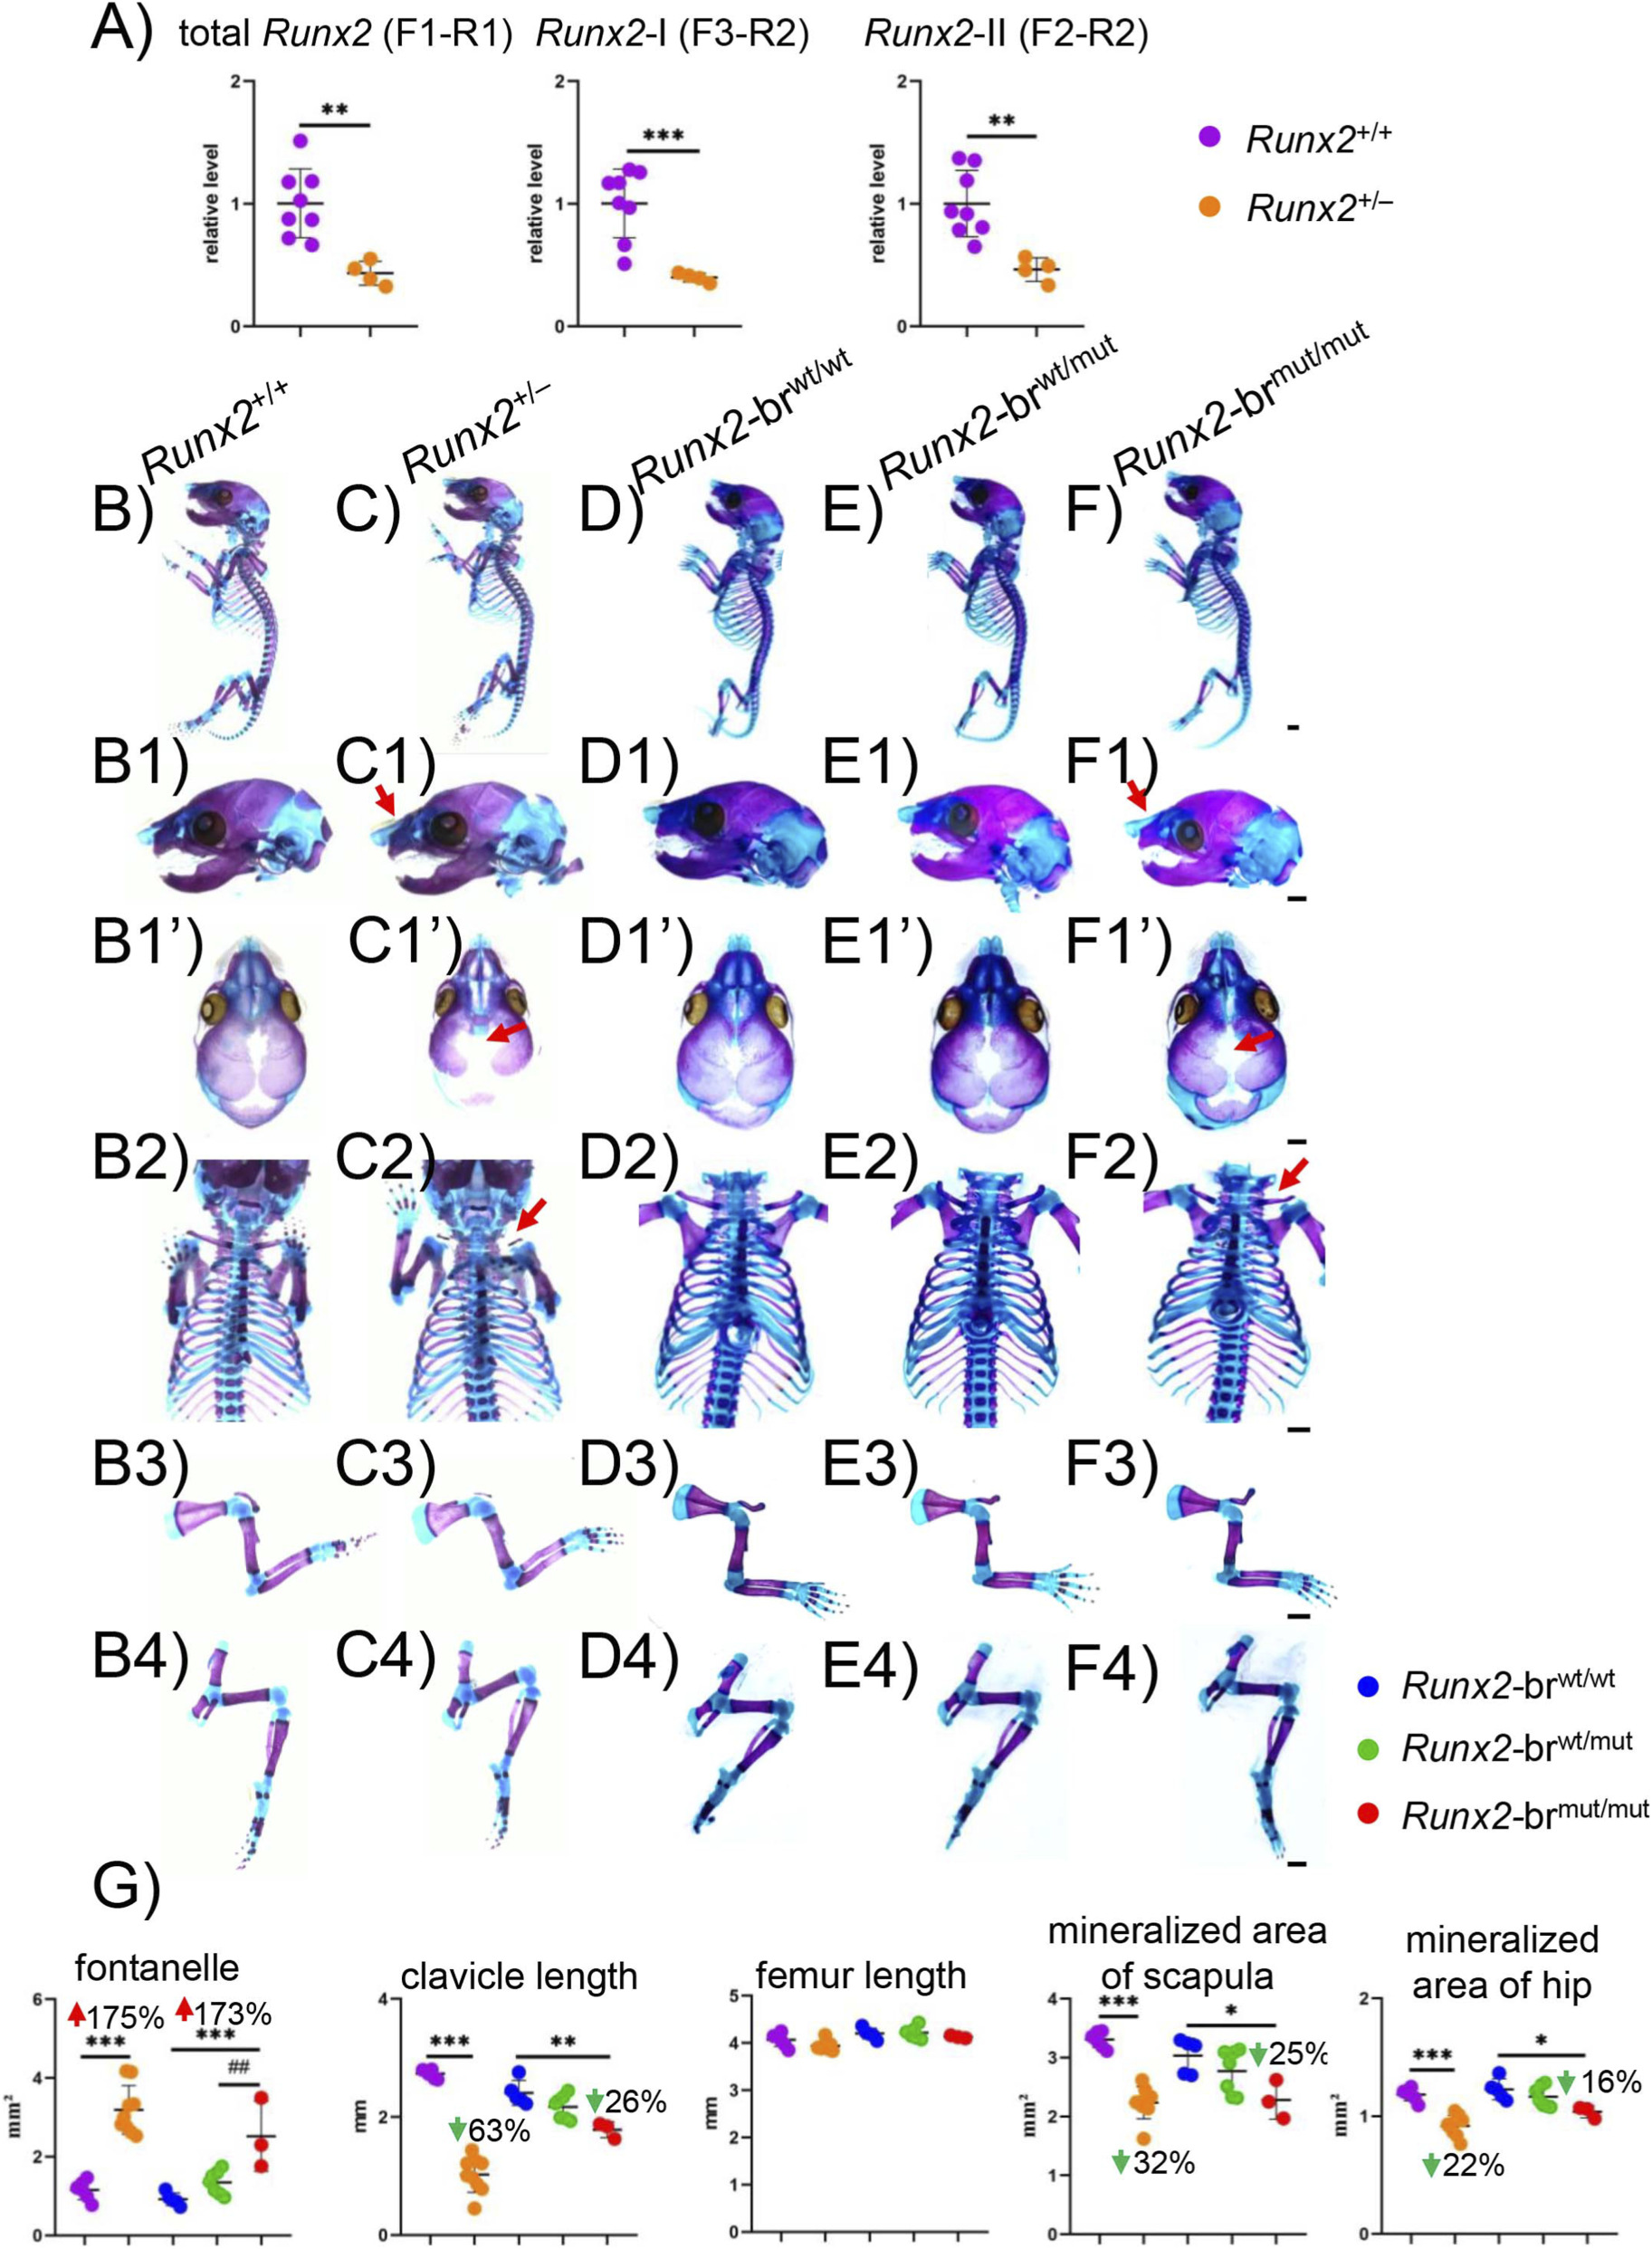
FIGURE 6 Skeletal system of Runx2+/? and Runx2-brmut/mut newborns. (A) Real-time RT-PCR was performed using 4-week-old calvaria from Runx2+/+ and Runx2+/? mice. The value of Runx2+/+ was set to 1, and the relative levels are shown. The number of mice analyzed: n = 8 (Runx2+/+), n = 4 (Runx2+/?). *Versus Runx2+/+ mice, **p < 0.01, ***p < 0.001. (B–F) Representative images of the skeletal system: lateral view of whole skeletons (B–F) lateral view of skulls (B1–F1) top view of skulls (B1’–F1’) clavicle, ribs, and sternum (B2–B2) hindlimbs (B3–F3) and forelimbs (B4–F4) in Runx2+/+, Runx2+/?, Runx2- brwt/wt, Runx2-brwt/mut and Runx2-brmut/mut mice. The red arrows in C1, F1, C1′, F1′, C2, and F2 indicate unmineralized nasal bones, open anterior fontanelles, and hypoplastic clavicles in Runx2+/? and Runx2-brmut/mut newborns. Scale bars: 1 mm. (G) Quantification of the anterior fontanelle area, clavicle length, femur length, and mineralized area of the scapulae and hip bones in Runx2+/+, Runx2+/?, Runx2-brwt/wt, Runx2-brwt/mut, and Runx2- brmut/mut mice. The number of mice analyzed: n = 6 (Runx2+/+), n = 9 (Runx2+/?), n = 5 (Runx2-brwt/wt), n = 7 (Runx2-brwt/mut), and n = 3 (Runx2-brmut/mut). *Versus Runx2-brwt/wt mice or Runx+/+ mice, #Versus Runx2-brwt/mut. *p < 0.05, **,##p < 0.01, ***p < 0.001.
模块 4:8 周成年小鼠骨微结构、动态骨形态计量与力学检测
1、研究逻辑:评估成年后长期骨代谢缺陷,明确 Runx2-II 缺失对骨量、骨形成速率、骨骼强度的持续性损伤;
2、核心实验:Micro-CT 股骨骨微结构、钙黄绿素双标动态骨计量、肱骨三点弯曲生物力学测试;
3、关键结果:
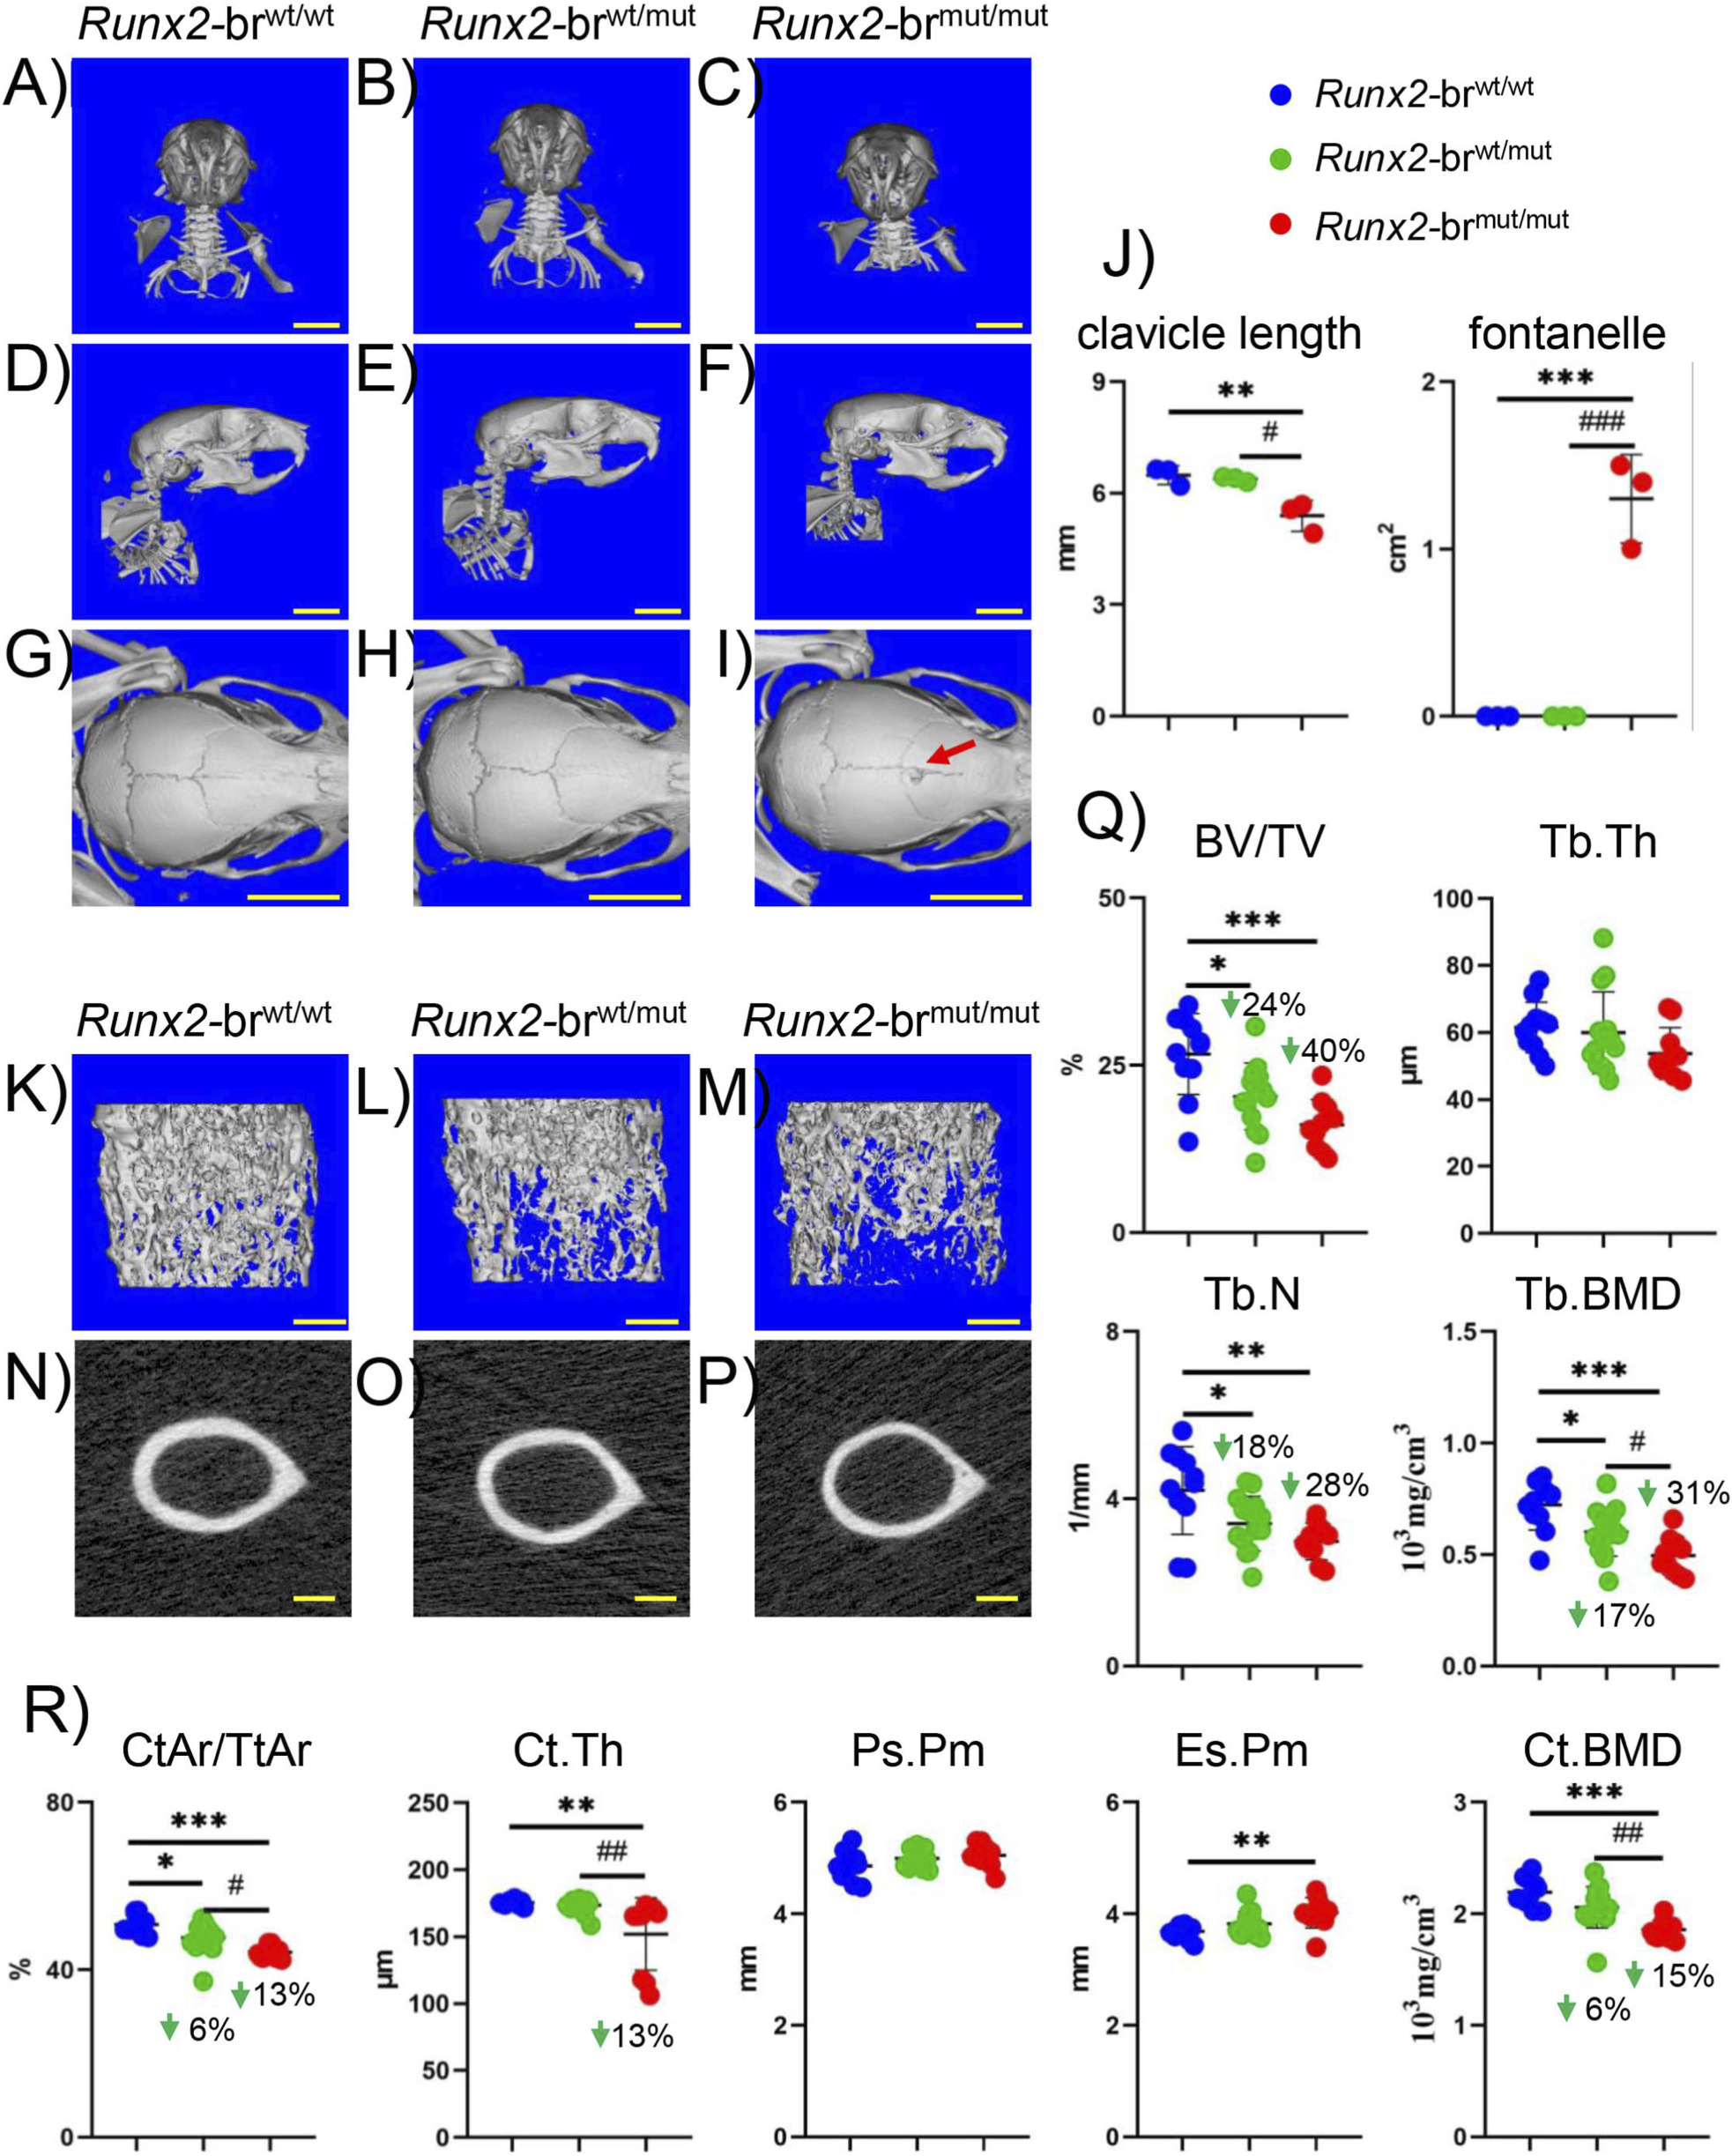
FIGURE 8 Micro-CT analyses of Runx2-brwt/wt, Runx2-brwt/mut, and Runx2-brmut/mut mice at 8 weeks of age. (A–I) Micro-CT images of the head and neck. Frontal view (A–C) lateral view (D–F) and top view (G–I) of the skulls. The right clavicle was cut to detach the humerus, whereas the left clavicle remained intact in the frontal view. The red arrow indicates the open frontal sutures (I). Scale bars: 5 mm. (J) Clavicle length and unmineralized area of the fontanel. n = 3. (K–M) Three-dimensional trabecular bone architecture of the distal femoral metaphysis. (N–P) Micro-CT images of the cortical bone at the middiaphysis of the femurs. (Q) Bone volume (BV)/tissue volume (TV), trabecular thickness (Tb.Th), trabecular number (Tb.N), and trabecular bone mineral density (Tb.BMD) in male mice. (R) Cortical area (CtAr)/total area (TtAr), cortical thickness (Ct.Th), periosteal perimeter (Ps.Pm), endosteal perimeter (Es.Pm), and cortical BMD (Ct.BMD) in male mice. Scale bars: 0.5 mm. The number of mice analyzed was n = 11 (Runx2-brwt/wt), n = 14 (Runx2-brwt/mut), and n = 10 (Runx2-brmut/mut). *Versus Runx2-brwt/wt mice, #Versus Runx2-brwt/mut mice, *,#p < 0.05, **,##p < 0.01, ***,###p < 0.001.
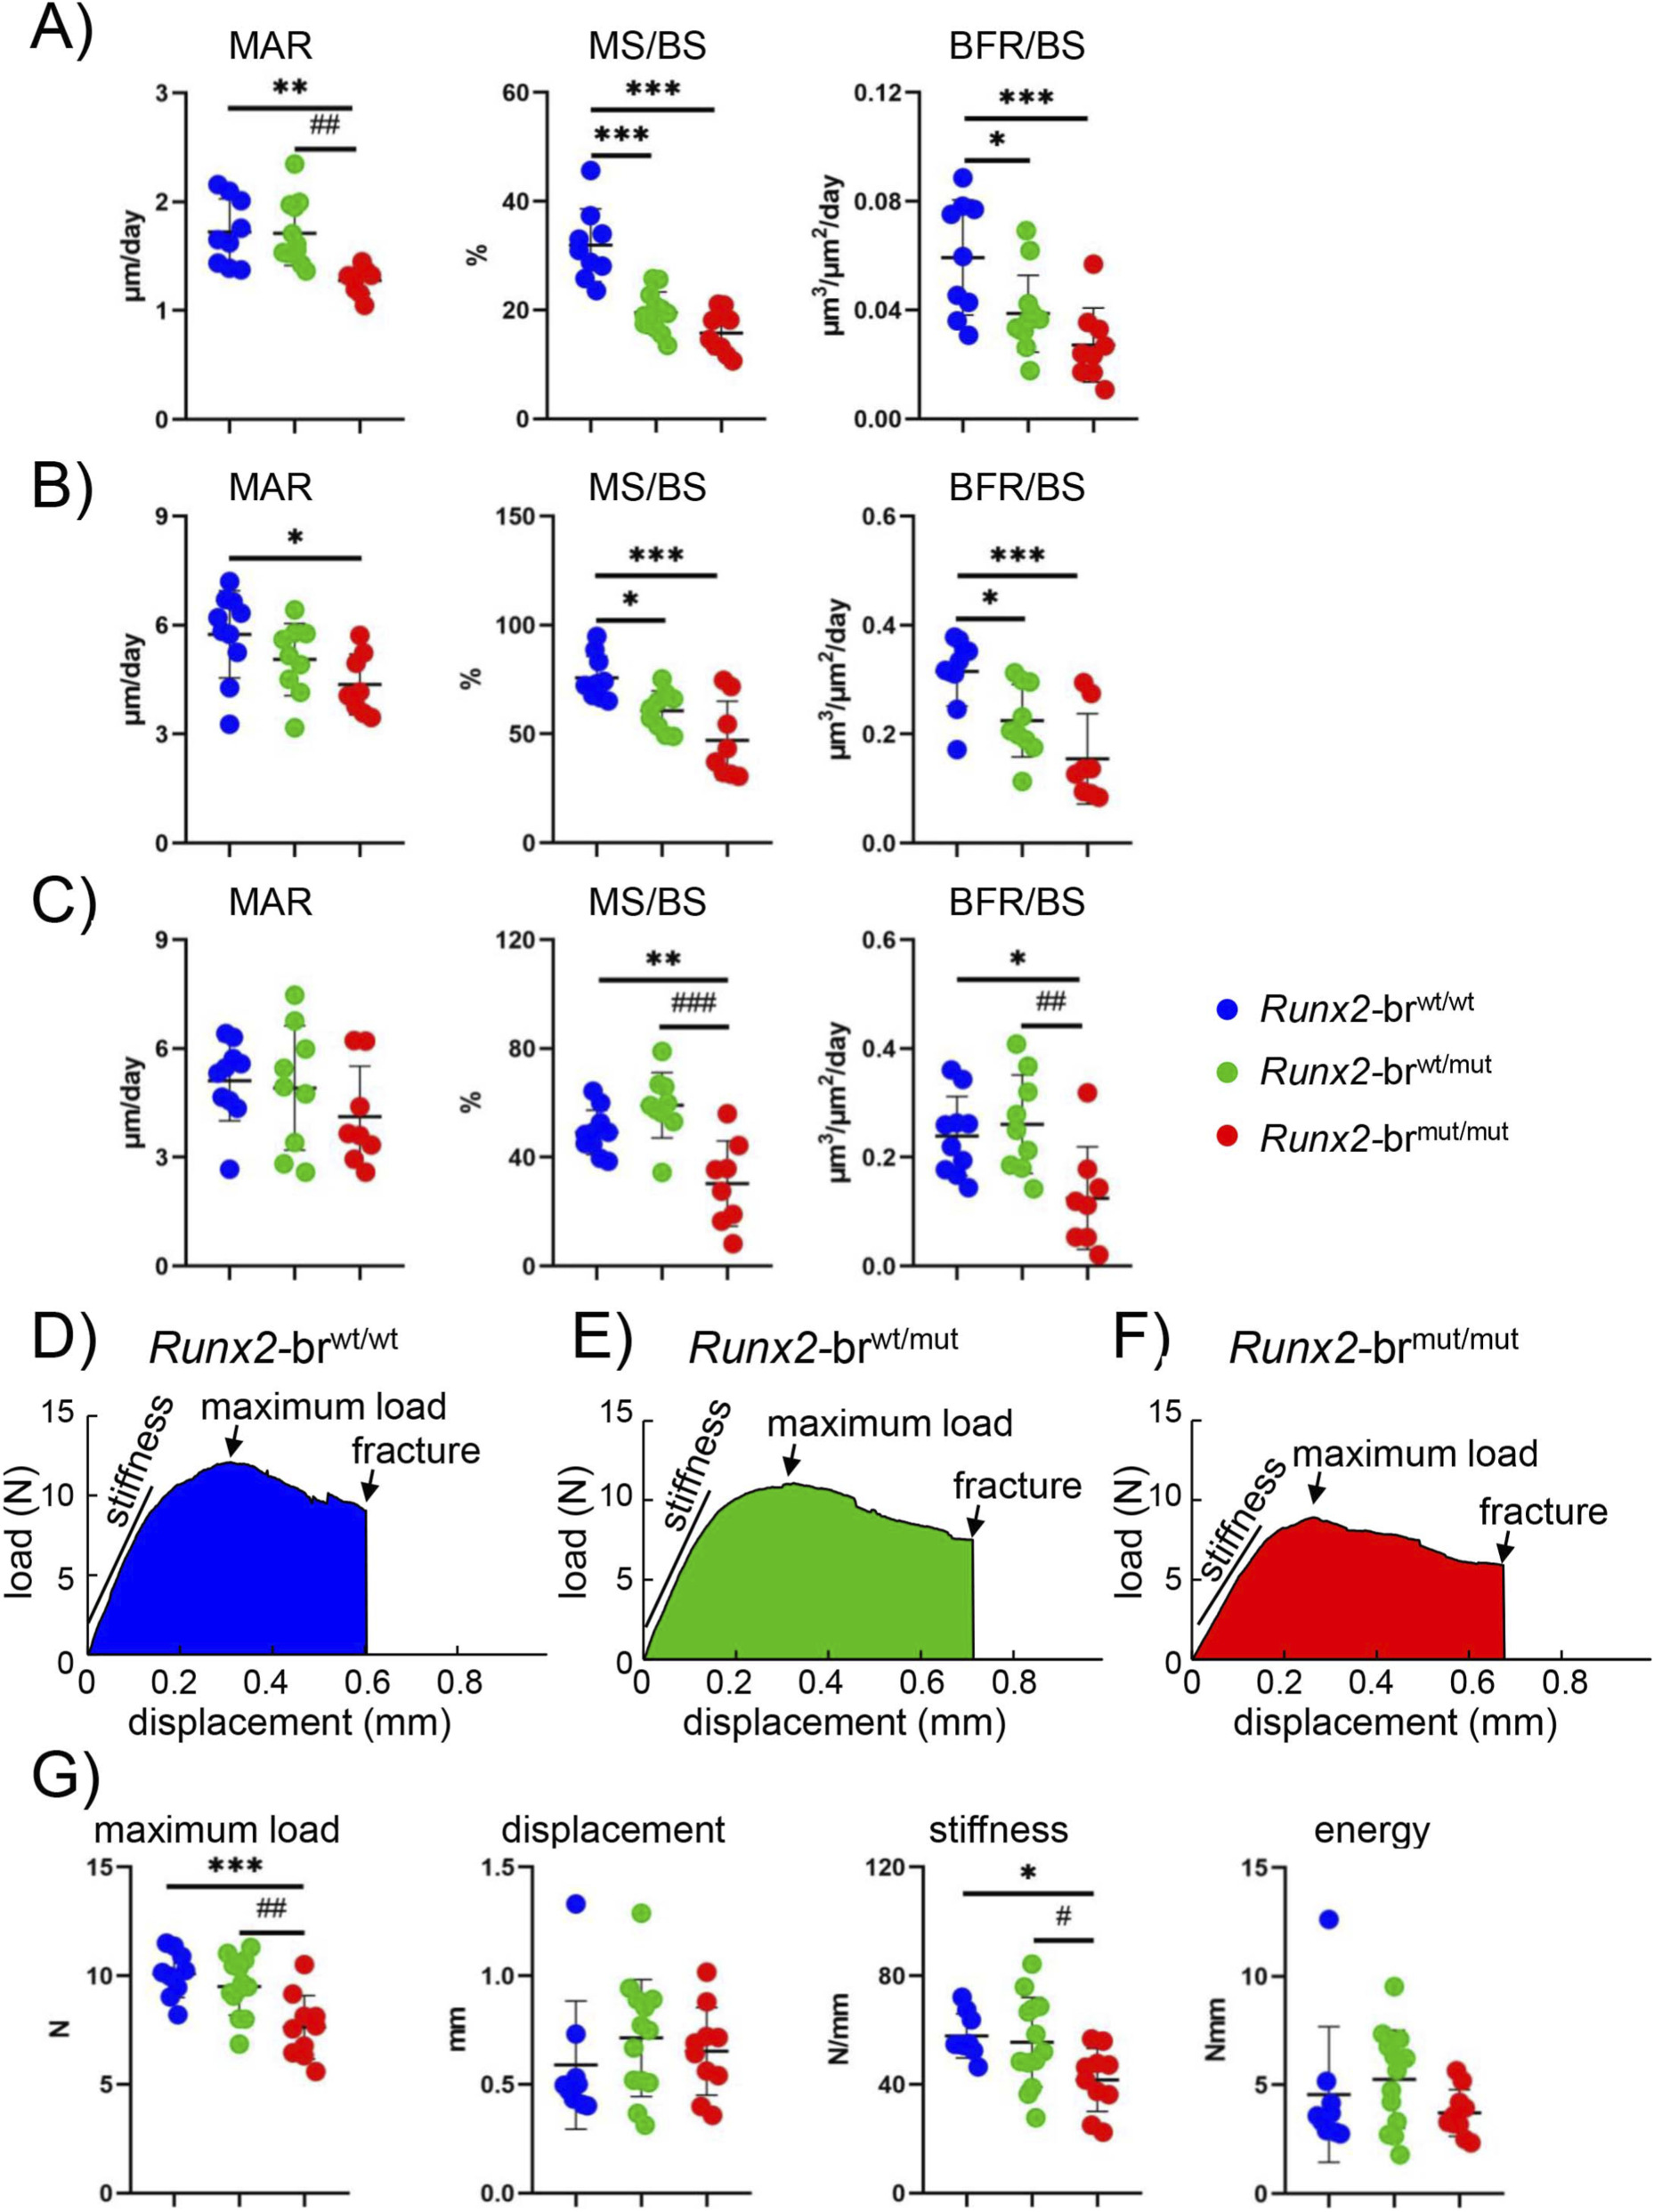
FIGURE 9 Dynamic bone histomorphometric analyses of femoral trabecular and cortical bone and three-point bending test using humeri in male Runx2-brwt/ wt, Runx2-brwt/mut, and Runx2-brmut/mut mice at 8 weeks of age. (A–C) Bone histomorphometric analysis. Mineral apposition rate (MAR), mineralizing surface (MS/BS), and bone formation rate (BFR/BS) in the trabecular bone (A) periosteum (B) and endosteum (C) of Runx2-brwt/wt, Runx2-brwt/mut, and Runx2-brmut/mut mice. The number of mice analyzed: n = 9 (Runx2-brwt/wt), n = 12 (Runx2-brwt/mut), and n = 9 (Runx2-brmut/mut) in trabecular bone; n = 10 (Runx2-brwt/wt), n = 9 (Runx2-brwt/mut), and n = 8 (Runx2-brmut/mut) in cortical bone. (D–G) Three-point bending tests. Representative loaddisplacement curves of the humeri in Runx2-brwt/wt (D) Runx2-brwt/mut (E) and Runx2-brmut/mut (F) mice and the mechanical parameters (G). The number of mice analyzed: n = 9 (Runx2-brwt/wt), n = 13 (Runx2-brwt/mut), and n = 10 (Runx2-brmut/mut). *Versus Runx2-brwt/wt mice, #versus Runx2-brwt/mut mice, *,#p < 0.05, **,##p < 0.01, ***,###p < 0.001.
模块 5:颅缝间充质细胞增殖实验(解释颅骨代偿机制)
1、研究逻辑:回答「为何突变小鼠颅骨畸形轻于Runx2+/-」,验证 Runx2-I 调控间充质增殖的特异性功能;
2、核心实验:P7 幼鼠 EdU 细胞增殖染色,分别检测颅缝间充质、生长板软骨、骨小梁成骨增殖比例;
3、关键结果:
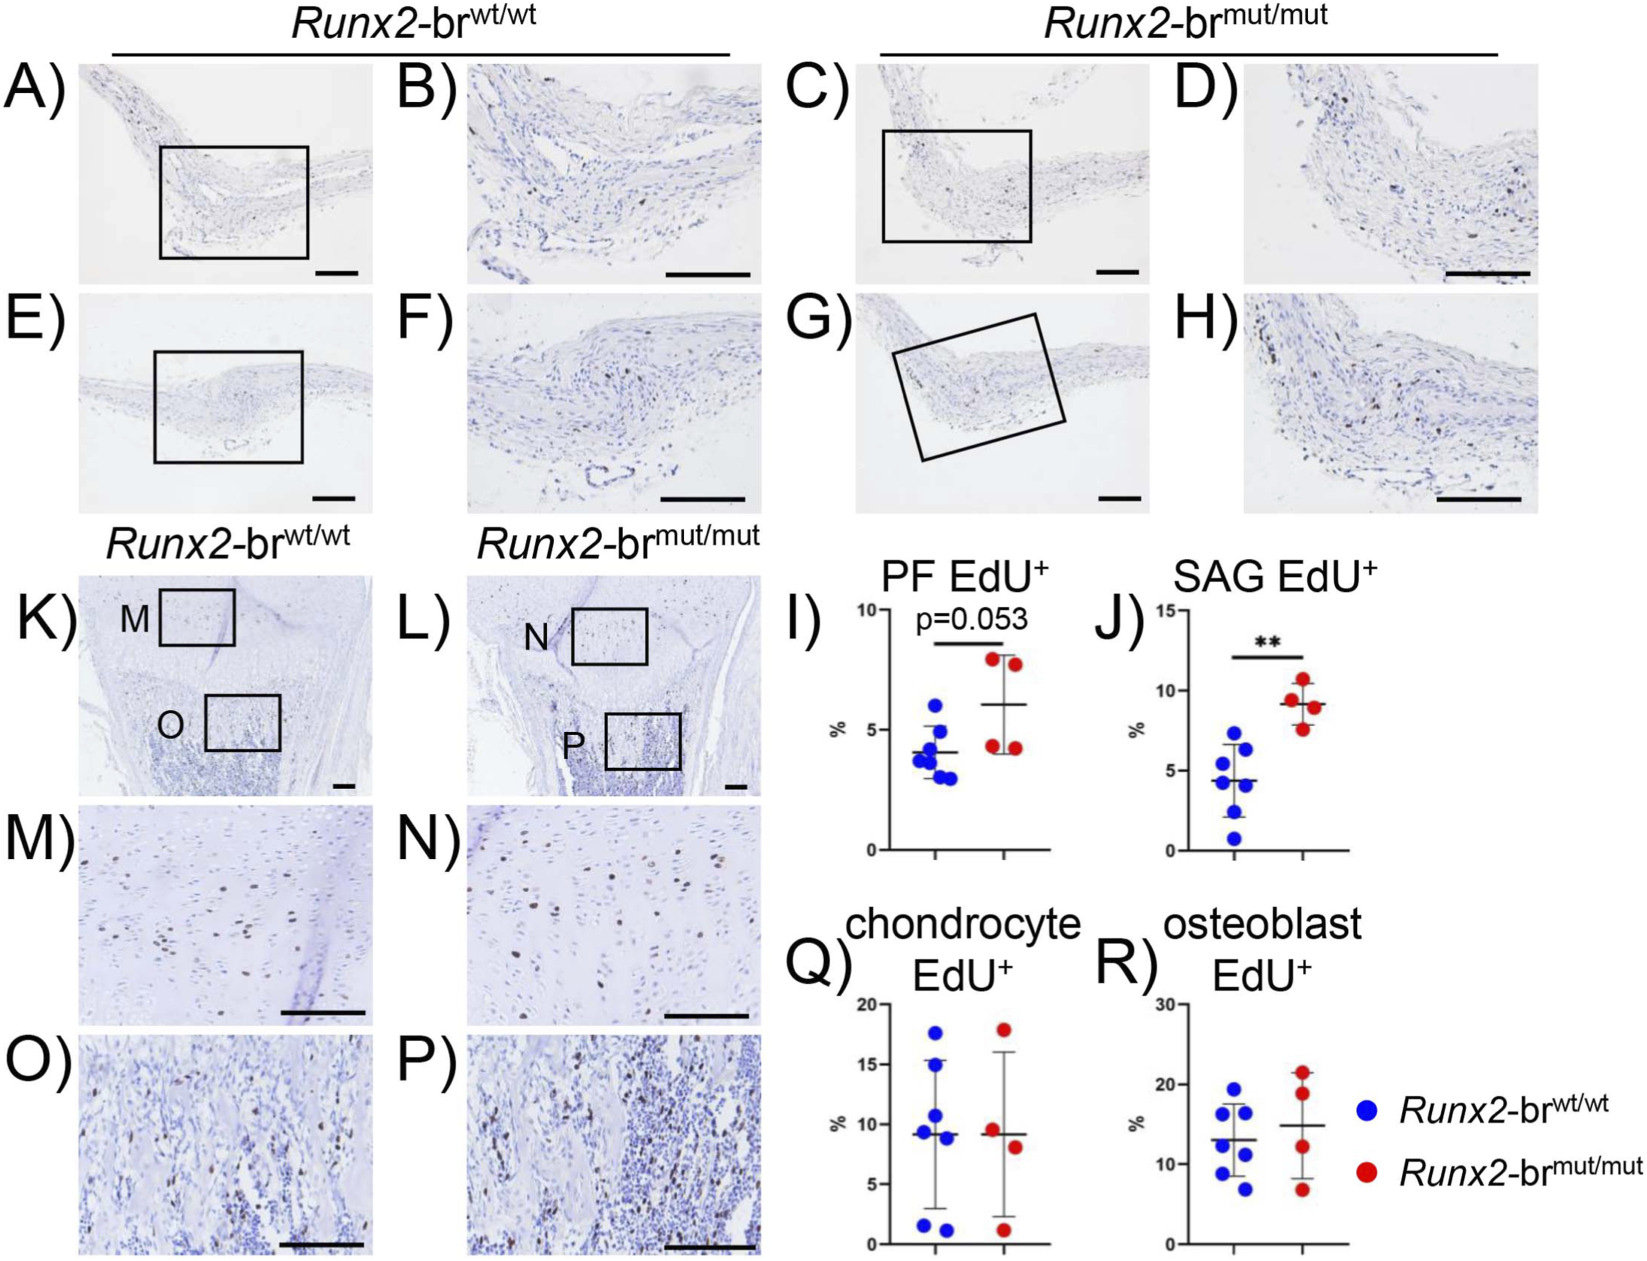
FIGURE 11 EdU staining of suture mesenchymal cells and femurs in Runx2-brwt/wt and Runx2-brmut/mut mice at P7. (A–J) EdU staining of the posterior frontal (PF) suture (A,C) and sagittal (SAG) suture (E,G) at P7. The boxed regions are magnified in the right column. The number of EdU+ cells and the total number of cells in the PF suture (B,D) and SAG suture (F,H) were counted, and the percentages of EdU+ cells are shown in I and J, respectively. (K–P) EdU staining in femoral sections from Runx2-brwt/wt and Runx2-brmut/mut mice. The upper boxed regions (proliferating chondrocyte layer) and the lower boxed regions (primary spongiosa) in (K,L) are magnified in (M–P) respectively. Scale bars: 0.1 mm. (Q) Percentage of EdU+ chondrocytes. (R) Percentage of EdU+ osteoblasts. Scale bars: 0.1 mm. The number of mice analyzed: n = 5 (Runx2-brwt/wt) and 4 (Runx2-brmut/mut). *Versus Runx2-brwt/wt mice, *p < 0.05, **p < 0.01, ***p < 0.001.
模块 6:体外 BMSC、原代成骨细胞分化实验
1、研究逻辑:体外细胞层面直接证明 Runx2-II 是成骨细胞谱系定向分化关键亚型;
2、核心实验:骨髓间充质干细胞(BMSC)、原代成骨(POB)成骨诱导、ALP 染色、Von Kossa 矿化染色、成骨标记基因 qPCR;
3、关键结果:
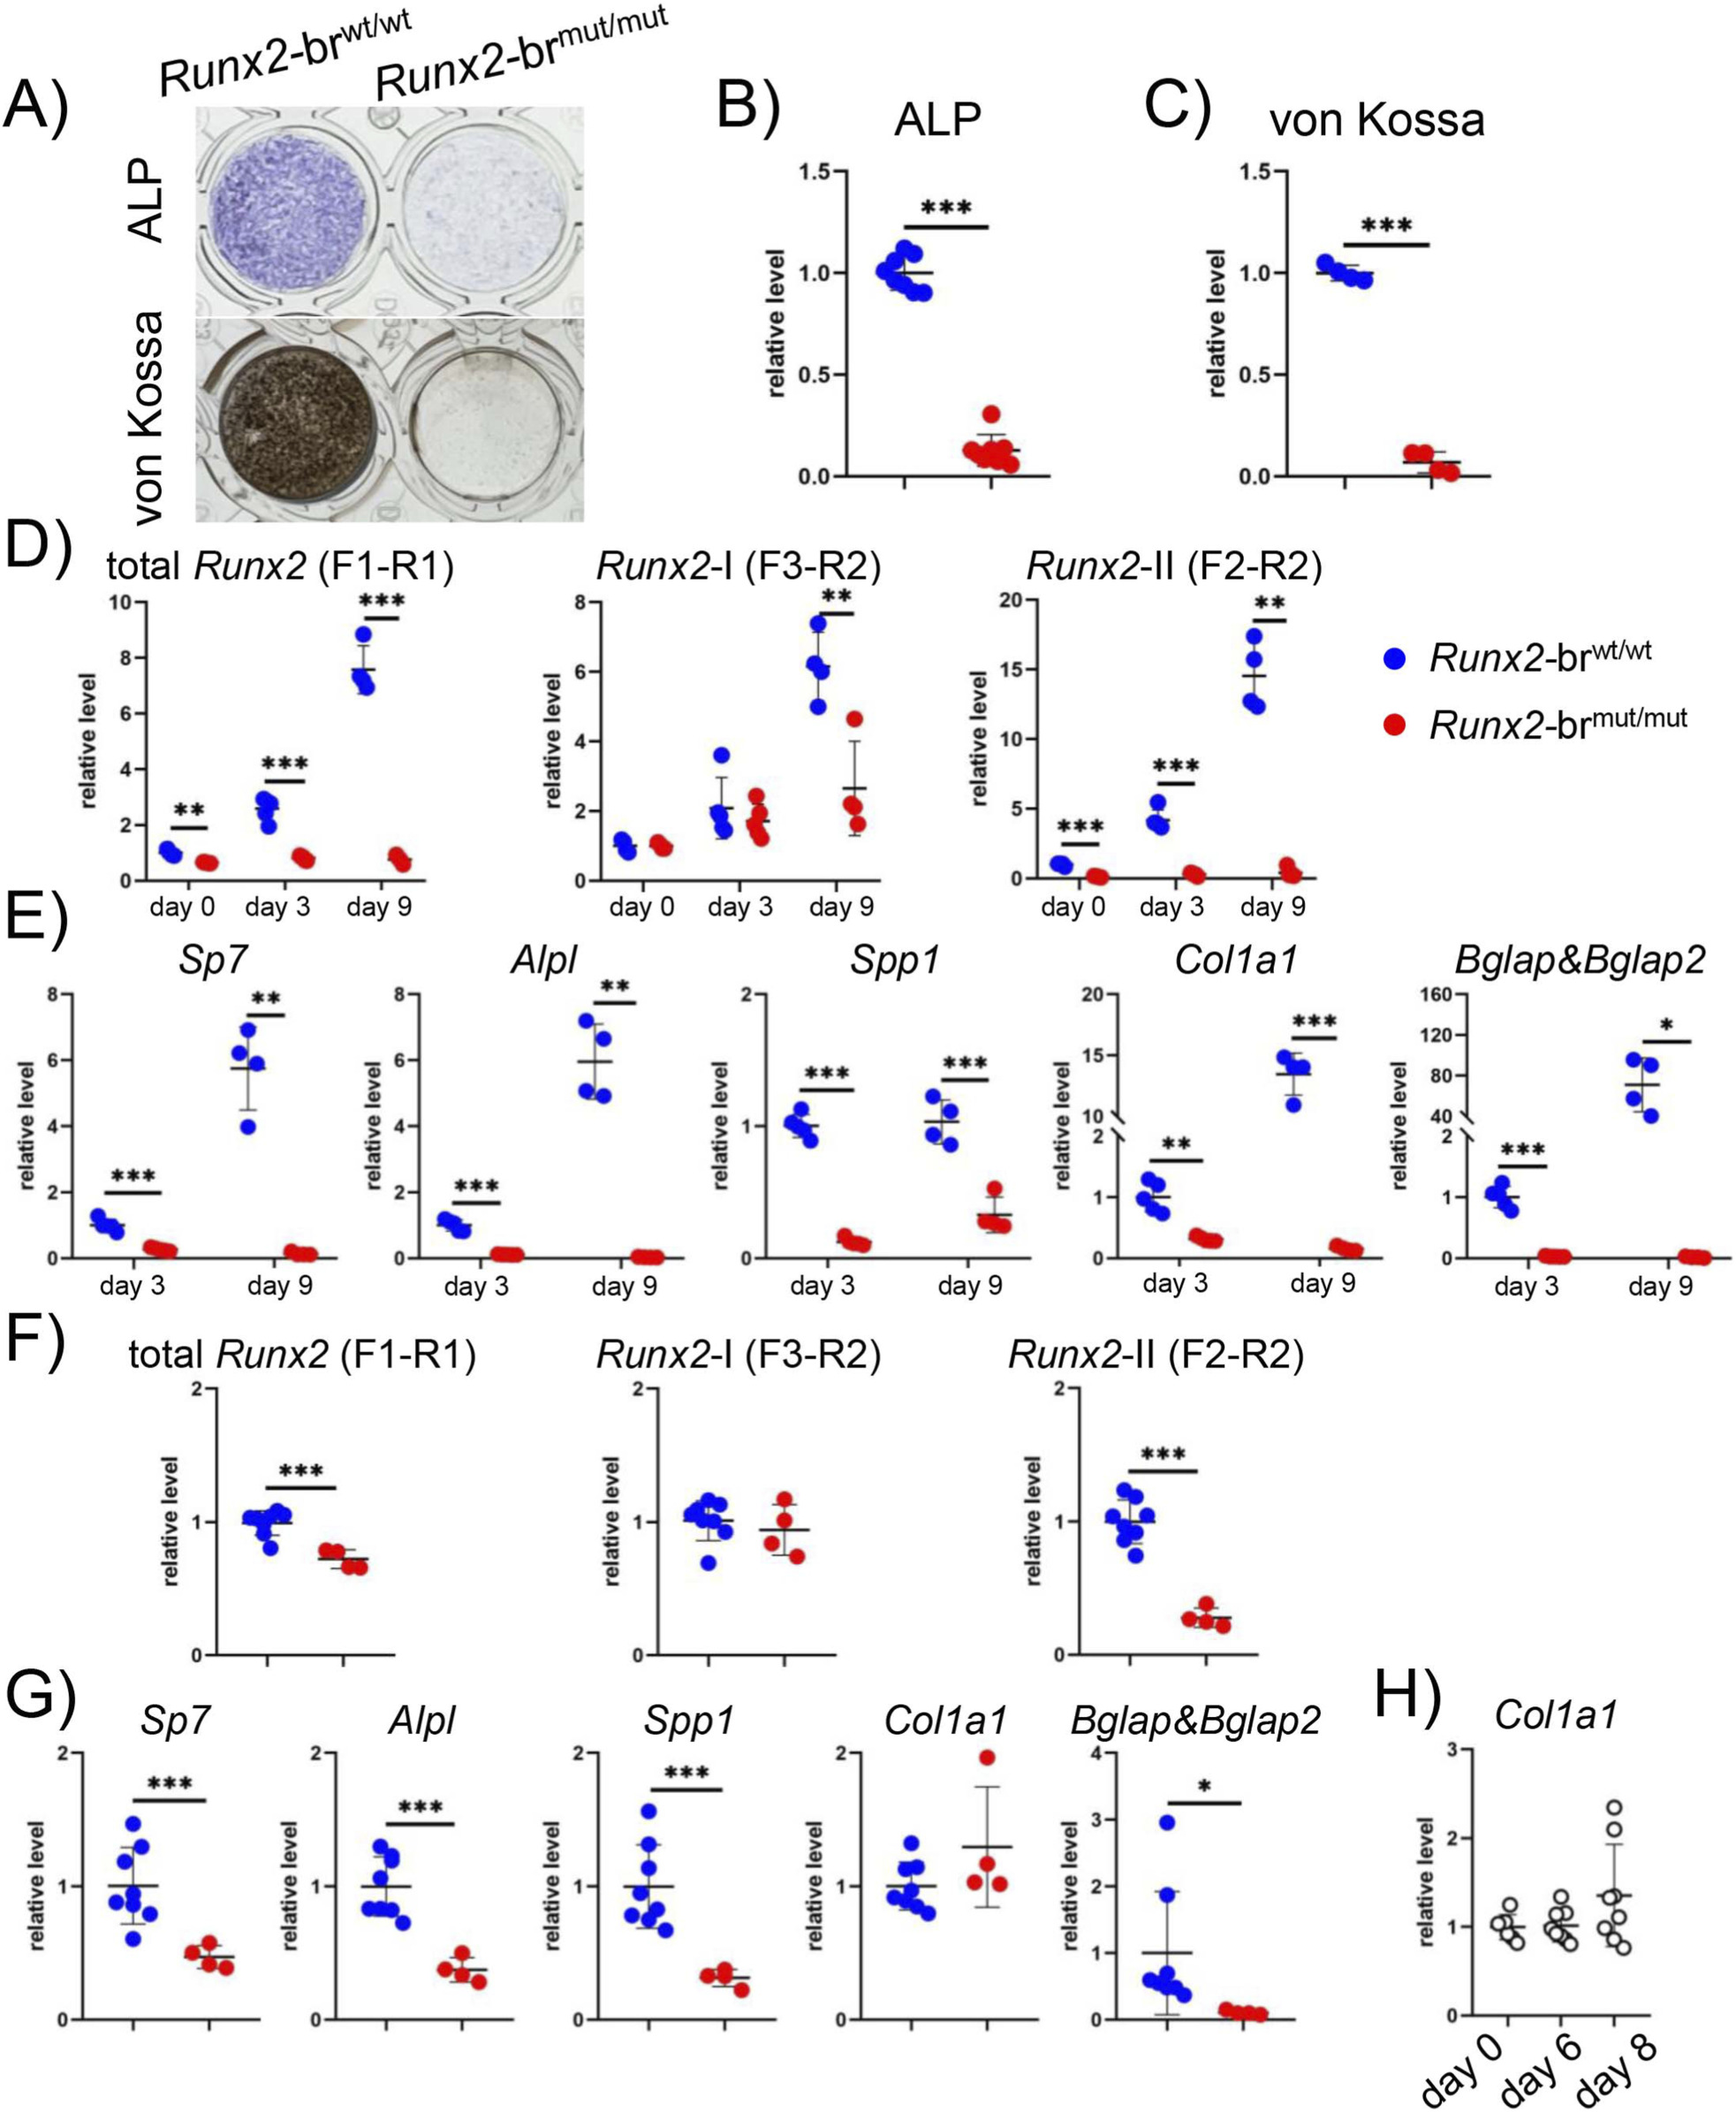
FIGURE 12 Culture of BMSCs and POB. (A–C) ALP and von Kossa staining of BMSCs from Runx2-brwt/wt and Runx2-brmut/mut mice. (D–G) Real-time RT-PCR analysis. Total Runx2, Runx2-I, and Runx2-II expression at days 0, 3, and 9 in BMSCs (D) and at day 6 in POB (F) and osteoblast differentiation marker gene expression at days 3 and 9 in BMSCs (E) and at day 6 in POB (G) were examined. The values of Runx2-brwt/wt mice were defined as 1, and the relative levels are shown. (H) Col1a1 expression in Runx2-brwt/wt POB during culture. The values of day 0 were defined as 1, and the relative levels are shown. Similar results were obtained in three independent experiments, and representative data are shown. The number of mice analyzed was n = 8 (Runx2-brwt/wt) and n = 8 (Runx2-brmut/mut) in ALP staining, n = 4 (Runx2-brwt/wt) and n = 4 (Runx2-brmut/mut) in von Kossa staining, n = 4 (Runx2-brwt/wt) and n = 4 (Runx2-brmut/mut) in day 0 and day 9 BMSCs differentiation, n = 5 (Runx2-brwt/wt) and n = 5 (Runx2-brmut/mut) in day 3 BMSCs differentiation, n = 8 (Runx2-brwt/wt) and n = 4 (Runx2-brmut/mut) in F and G, n = 7, n = 8 and n = 8 in day 0, day 6 and day 8 of POB differentiation (H), respectively. *Versus Runx2-brwt/wt mice, *p < 0.05, **p < 0.01, ***p < 0.001.
模块 7:Runx2 转录自调控机制验证
1、研究逻辑:探究突变体 Runx2-I 上调是否由 Runx2 蛋白负反馈介导,解析 P1/P2 双启动子调控模式;
2、核心实验:MC3T3-E1 细胞 Runx2 过表达、siRNA 敲低、P2 启动子荧光素酶报告实验;
3、关键结果:
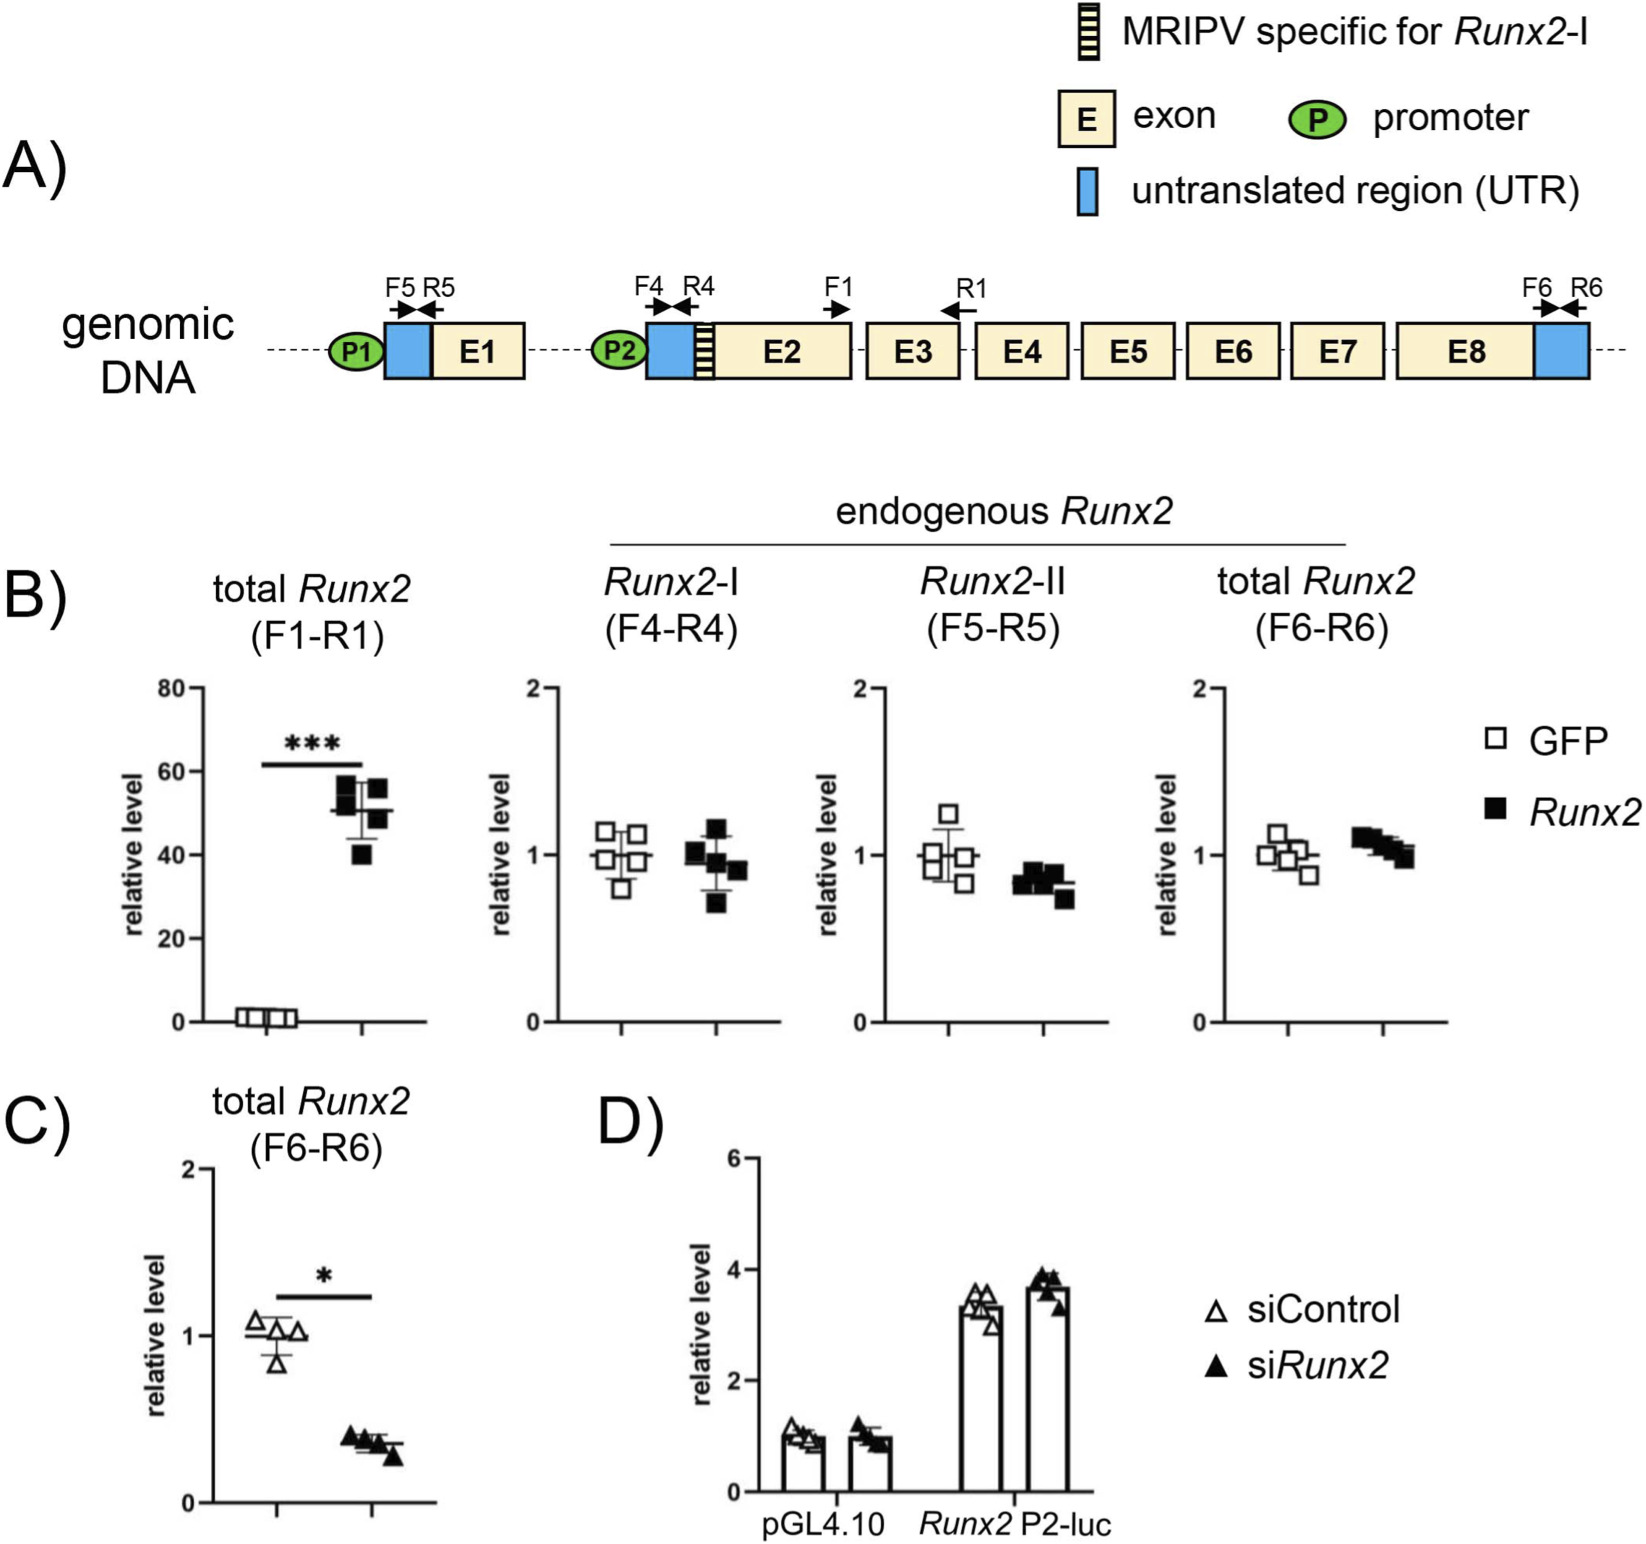
FIGURE 13 Overexpression of Runx2 and P2 reporter assay using MC3T3-E1 cells. (A) Schematic presentation of untranslated regions of Runx2 mRNA. Primer sets F1–R1, F4–R4, F5–R5, and F6–R6 were used to detect total Runx2, including exogenous and endogenous Runx2, endogenous Runx2-I, endogenous Runx2-II, and total endogenous Runx2, respectively. The R1 primer sequence includes exons 3 and 4. (B) Overexpression of Runx2 in MC3T3-E1 cells. GFP- or Runx2-expressing vectors were transfected into MC3T3-E1 cells, and total Runx2 (F1–R1), including exogenous and endogenous Runx2, and endogenous Runx2-I (F4–R4), Runx2-II (F5–R5), and total Runx2 (F6–R6) were examined by real-time RT-PCR. (C,D) P2 reporter assays. MC3T3-E1 cells were transfected with siRNA for control (siControl) or Runx2 (siRunx2). Runx2 mRNA was examined 48 h after transfection (C). The value in siControl was defined as 1, and the relative level is shown. pVersus siControl, pp < 0.05. The transfected cells were further transfected with pGL4.10 empty vector or 1.9- kb P2-Luc, and luciferase activity was measured (D). Similar results were obtained in three independent experiments, and representative data are shown.
五、Absin Fast Red Violet LB salt 产品整体作用总结

- 手机:13761418683