




- 手机:13761418683
联系人:爱必信
网址:http://www.absin.cn/
地 址:上海市浦东新区新浩路58号18号楼

- 多公共数据集(MMRF CoMMpass、GEO)+ 临床患者样本验证 DKC1 高表达与晚期、复发、不良生存显著相关;
- Cox 回归、决策树、时间依赖 ROC 证明 DKC1 为独立预后因子,优化 ISS 分期分层效能;
- 构建 DKC1 稳敲除 / 过表达骨髓瘤细胞株(RPMI8226、MM.1S),EdU、软琼脂、凋亡、侵袭实验明确 DKC1 促癌表型;
- DKC1 抑制剂 PF 梯度给药体外验证抑瘤效果,排除对正常外周血单核细胞(PBMC)损伤;
- NCG 裸鼠皮下荷瘤模型,分为 DKC 敲除细胞组、PF 药物干预组,结合活体成像、肿瘤重量、增殖凋亡 IHC 验证体内抑瘤作用;
- mRNA 测序筛选 DKC1 敲除后差异基因,锁定凋亡与增殖交集核心靶基因 ATF5;
- RIP、CMC 单碱基假尿苷测序证实 DKC1 直接结合并修饰 ATF5 mRNA,提升其半衰期;
- ATF5 回救敲除 DKC 细胞、ATF5 敲低过表达 DKC 细胞,反向验证 DKC1 依赖 ATF5 发挥致癌功能,完整建立 DKC1-pseudouridylation-ATF5-Bcl2 调控轴。
- DKC1 表达梯度升高:MGUS <MM < PCL,复发 MM 高于初发,ISS III 期> I/II 期,MM 患者骨髓样本 DKC1 显著高于健康人;
- KM 曲线:DKC1 高表达组 OS、PFS 显著缩短;多因素 Cox 证实 DKC1 是 OS、PFS 独立危险因素;
- 纳入 DKC 后预后模型 C-index 升高、IBS 降低,预测精准度提升;决策树以 DKC1、B2M 分层,1/2/3 年 AUC 可达 0.77-0.79,DKC 变量重要性高于白蛋白、β2 微球蛋白。
- shDKC 组 EdU 阳性细胞、克隆数大幅下降,S 期细胞减少;oeDKC 增殖、克隆能力上升;PF 呈浓度依赖性抑制细胞增殖;
- shDKC 自发凋亡显著增多,促凋亡 Bax 上调、抗凋亡 Bcl2 下调;营养剥夺下 oeDKC 可明显减少细胞凋亡;0.2-0.8μM PF 剂量依赖性诱导 MM 凋亡,对患者正常 PBMC 无明显毒性;
- DKC1 敲除抑制骨髓瘤细胞侵袭,过表达增强侵袭能力。
- shDKC 组肿瘤体积、重量显著低于对照组,肿瘤 Ki67 阳性率下降、TUNEL 凋亡细胞上升;
- PF 给药组活体发光强度显著弱于溶剂对照组,肿瘤生长缓慢、重量降低;
- PF 处理小鼠心肝肾 H&E 无明显损伤,巨噬细胞、中性粒细胞浸润无差异,体内安全性良好。
- 凋亡、增殖通路交集 70 个基因,ATF5 下调幅度最大(log2FC=-3.46);DKC 与 ATF5 表达呈显著正相关(r=0.17,P<0.001);
- shDKC 显著下调 ATF5 mRNA、蛋白,oeDKC 上调 ATF5;DKC 敲除大幅缩短 ATF5 mRNA 半衰期;RIP 证实 DKC 蛋白直接结合 ATF5 mRNA。
- ATF5 编码区存在 4 个 DKC 依赖假尿苷修饰位点,DKC 敲除后修饰几乎消失;假尿苷修饰缺失直接降低 ATF5 mRNA 稳定性;
- 过表达 ATF5 可部分恢复 shDKC 造成的增殖下降、凋亡上升;敲低 ATF5 逆转 oeDKC 促癌表型;
- 机制模式:DKC1 上调→ATF5 mRNA 假尿苷修饰增多→ATF5 蛋白积累→Bcl2 上调→骨髓瘤增殖增强、凋亡抑制。
- 体内药效可视化定量核心底物:本研究 PF 药物干预活体成像实验全程依赖 Absin D - 荧光素钾盐,与肿瘤细胞稳定表达的荧光素酶发生生物发光反应,通过发光强度精准、动态追踪小鼠体内肿瘤负荷,直观对比药物组与对照组肿瘤生长差异,提供无创伤活体定量证据;
- 数据串联体外 - 体内药效:体外细胞增殖、凋亡实验仅反映细胞层面效应,活体发光成像依托该产品将细胞表型转化为动物体内整体肿瘤生长数据,完整支撑 PF 作为 DKC 抑制剂体内抗骨髓瘤药效结论,符合高分转化医学期刊体内药效可视化质控标准;
- 支撑靶点临床转化论证:无创伤活体成像可动态监测长期药物干预效果,结合脏器病理共同证明 PF 抑瘤同时无明显系统毒性,为 DKC 作为 MM 治疗靶点、PF 临床用药潜力提供关键体内可视化佐证,是本动物实验模块不可或缺的核心试剂。
《DKC1: a robust prognostic factor and potential therapeutic target in multiple myeloma》SCI 文献深度解析
2026-08-06
一、文献基础综述
(一)期刊与基础信息
期刊:Journal of Translational Medicine;2026 年最新影响因子 IF=9.7,中科院医学 2 区 SCI 开放转化医学期刊;
DOI:10.1186/s12967-026-07916-6;卷期:2026, 24:497;
论文标题:DKC1: a robust prognostic factor and potential therapeutic target in multiple myeloma;
(二)全文核心结论
假尿苷合成酶 DKC1 在多发性骨髓瘤(MM)中高表达,是患者总生存期(OS)、无进展生存期(PFS)独立不良预后标志物,可优化 ISS 分期系统实现更精准风险分层;细胞与动物实验证实 DKC1 促进骨髓瘤细胞增殖、抑制凋亡、驱动体内肿瘤生长;机制上 DKC1 通过对 ATF5 mRNA 进行位点特异性假尿苷修饰,提升 ATF mRNA 稳定性,上调抗凋亡蛋白 Bcl-2 推动疾病进展;DKC1 抑制剂吡唑呋喃菌素(PF)可显著抑制体内外骨髓瘤活性,脏器毒性极低,DKC-ATF5 轴为 MM 全新预后标志物与治疗靶点。
(三)爱必信 Absin 产品应用简述
研究采用abs42017259 D - 荧光素钾盐作为活体生物发光成像底物,标记荧光素酶稳转骨髓瘤荷瘤小鼠,直观定量 PF 药物干预后体内肿瘤负荷动态变化,为体内药效提供可视化定量数据支撑。
二、研究领域背景介绍
多发性骨髓瘤(MM)是发病率第二的血液浆细胞恶性肿瘤,1990-2021 年全球发病率涨幅达 167%,进展路径多为意义未明单克隆丙种球蛋白病(MGUS)→冒烟型骨髓瘤(SMM)→活动性 MM,浆细胞白血病(PCL)为高侵袭亚型。现有治疗手段包括蛋白酶体抑制剂、免疫调节剂、单抗、CAR-T、自体造血干细胞移植,但耐药与复发问题无法根除,疾病仍不可治愈。
临床传统 ISS 分期依靠白蛋白、β2 微球蛋白分层,存在大量低危患者早期复发的局限性,亟需分子标志物补充分层;DKC1 编码角化不良蛋白,经典功能为调控端粒酶、rRNA/snoRNA 假尿苷修饰,在神经母细胞瘤、肝癌、乳腺癌中作为癌基因,但在垂体癌、皮肤鳞癌中抑癌,具备组织依赖性功能;既往研究仅聚焦 DKC1 对核糖体 RNA 修饰,DKC1 介导 mRNA 假尿苷修饰在骨髓瘤中的作用完全未知,本研究首次在 MM 体系完整阐明 DKC 临床预后价值、体内体外功能及 mRNA 修饰分子通路,填补该领域空白。
三、作者整体递进研究思路总结
全文遵循临床生信挖掘→临床样本验证→体外细胞功能(敲除 / 过表达 / 药物干预)→体内异种移植药效→转录组筛选下游靶基因→mRNA 假尿苷修饰机制验证→回救实验通路确认8 层完整转化医学逻辑链:
四、分模块详细研究思路、实验结果、对应原文图片
模块 1:DKC1 表达与 MM 不良临床特征、预后分层研究
1、研究逻辑:多数据库 + 临床样本关联 DKC1 表达与疾病分期、复发、生存,统计模型证明独立预后价值,建立 DKC 联合 ISS 分层体系;
2、核心实验:GEO/MMRF 公共数据集转录组、蛋白组分析;KM 生存曲线;单 / 多因素 Cox 回归;列线图、校准曲线;决策树 + 时间依赖 ROC;变量重要性分析;
3、关键实验结果:
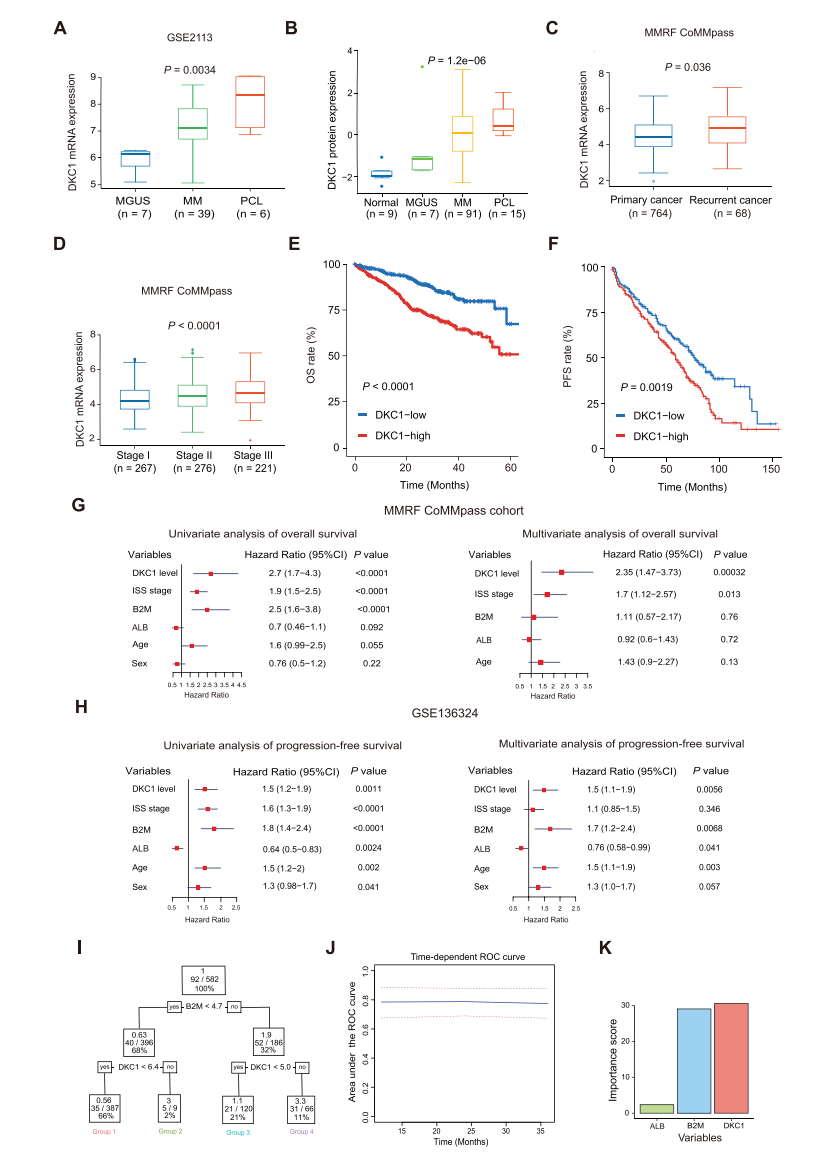
Fig. 1 DKC1 expression is correlated with adverse clinical features and serves as a biomarker for prognostic evaluation and disease staging in MM. A DKC1 mRNA expression in MM and PCL patients compared to MGUS patients from GSE2113 dataset. B DKC1 protein expression across healthy controls, MGUS, MM, and PCL patients. C, D DKC1 mRNA expression analysis from the MMRF CoMMpass dataset. C DKC1 mRNA expression in primary and recurrent patients. D DKC1 mRNA expression across different ISS stages. E Kaplan-Meier survival analysis of OS in MMRF CoMMpass dataset for DKC1-high (n=392) and DKC1-low (n=393) patients. F Kaplan-Meier survival curves for PFS in GSE136324 dataset for DKC1-high (n=218) and DKC1-low (n=218) patients. G, H Univariate (left) and multivariate (right) Cox regression analyses for OS (G) and PFS (H), using data from MMRF CoMMpass dataset and GSE136324 dataset respectively. I Decision tree analysis based on DKC1, B2M and ALB for risk stratification in MM patients. J Time-dependent ROC curve evaluating the predictive performance of the model over time. K Estimation of variable importance based on the decision tree model. Abbreviations: plasma cell leukemia (PCL); multiple myeloma (MM); monoclonal gammopathy of undetermined significance (MGUS); overall survival (OS); progression-free survival (PFS); β2-microglobulin (B2M); albumin (ALB); receiver operating characteristic (ROC)
模块 2:体外细胞实验证实 DKC1 促进 MM 增殖、侵袭、抑制凋亡
1、研究逻辑:DKC1 敲除(shDKC)、DKC1 过表达(oeDKC)、DKC 抑制剂 PF 三组对比,从增殖、克隆、周期、凋亡、侵袭多维度验证癌基因功能;
2、核心实验:慢病毒稳转细胞构建;EdU 增殖、软琼脂克隆形成;流式细胞周期、Annexin V 凋亡;Transwell 侵袭;WB 凋亡蛋白 Bax/Bcl2;PF 梯度药物干预;
3、关键实验结果:
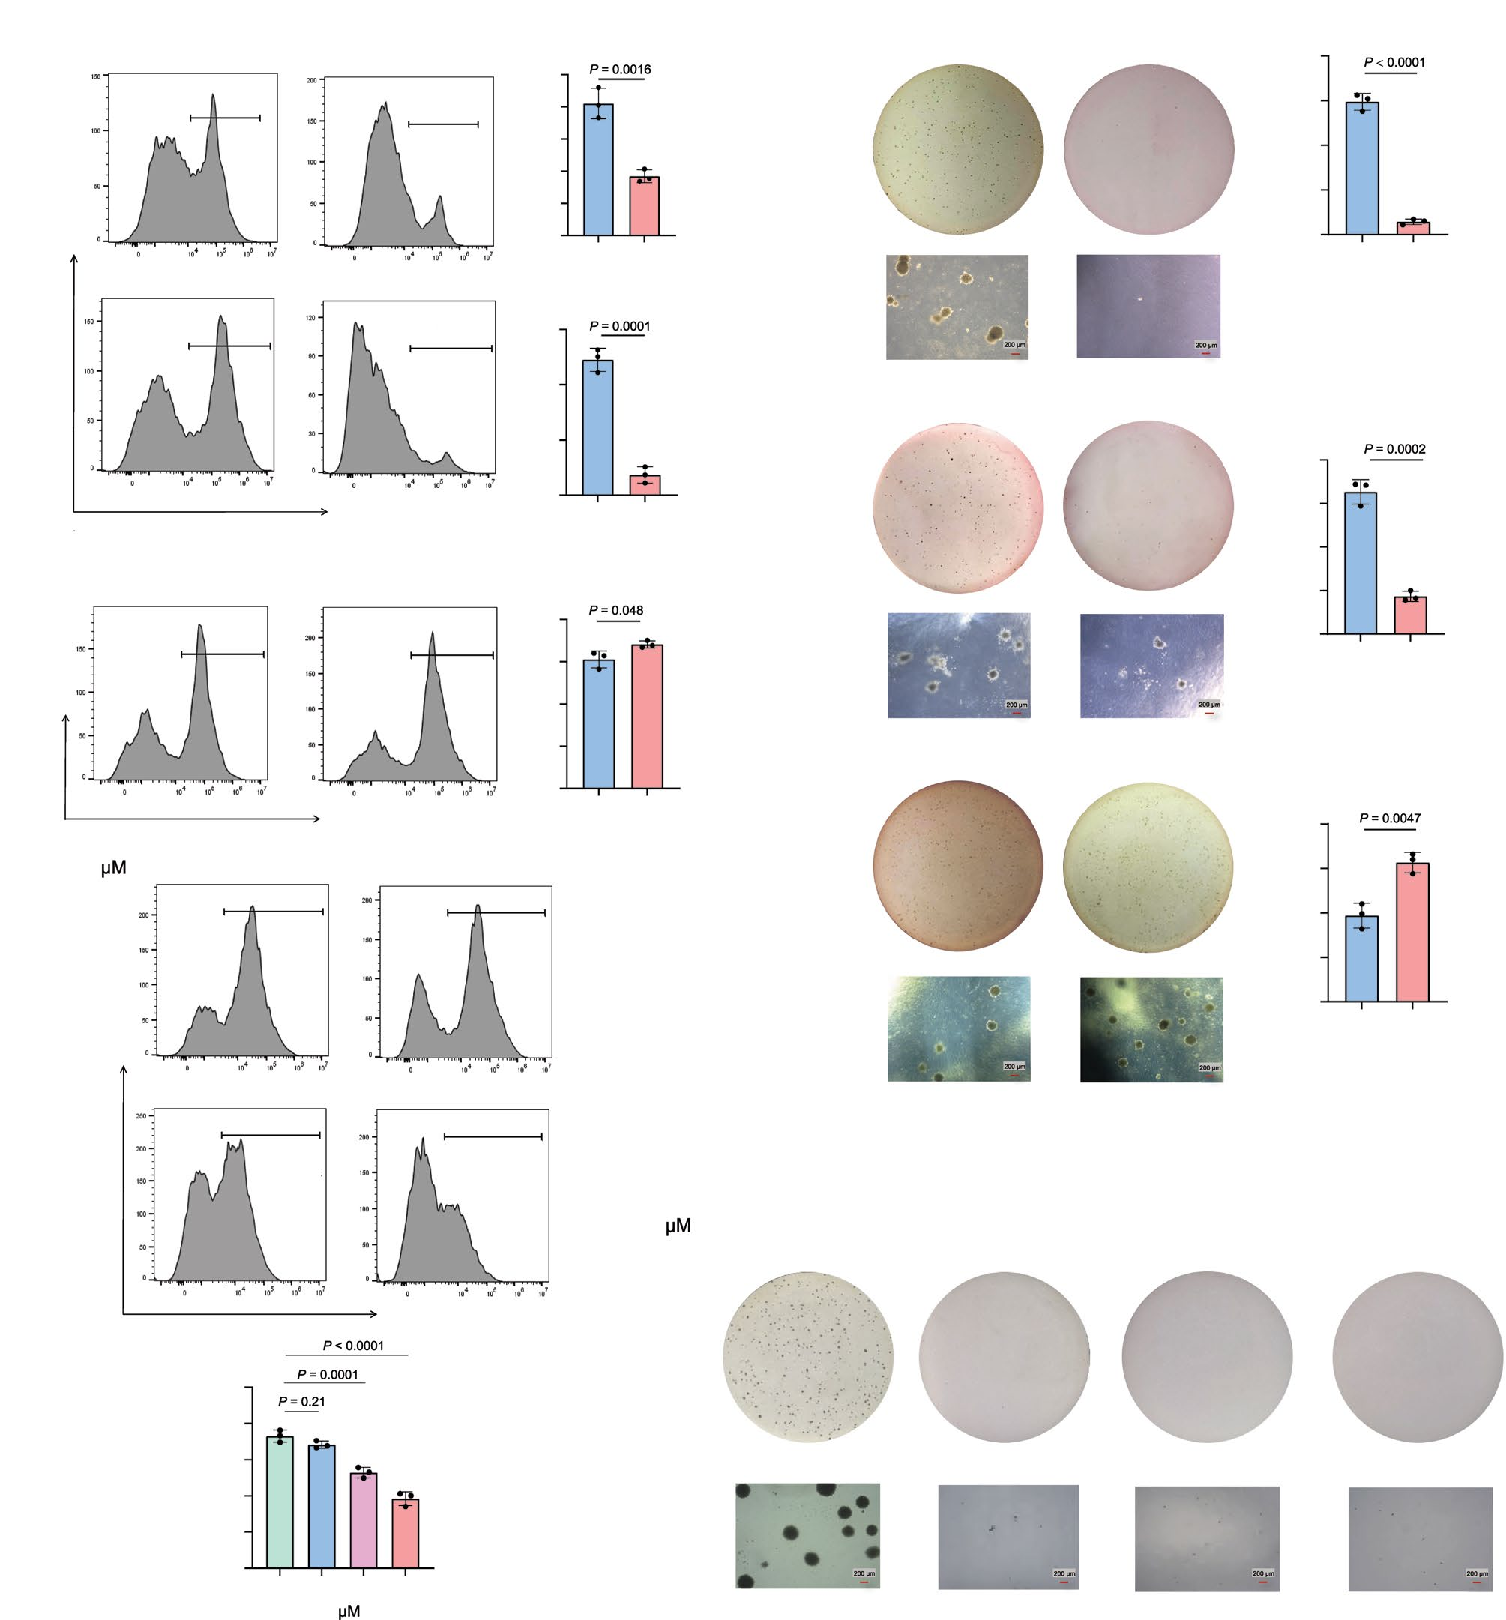
Fig. 2 DKC1 promotes proliferation of MM cells. A, B EdU staining (A) and soft agar colony formation (B) of MM cells following DKC1 knockdown (shDKC1) in RPMI8226 and MM.1S cells or DKC1 overexpression (oeDKC1) in RPMI8226 cells, with corresponding control cells (MOCK1 for knockdown, MOCK2 for overexpression) (scale bar=200μm). C, D EdU staining (C) and soft agar colony formation (D) of MM cells treated with PF at 0.2, 0.4, and 0.8μM, with an equivalent volume of vehicle used as the control (0μM PF) (scale bar=200μm). Data are presented as mean±SD from three independent experiments. Abbreviations: pyrazofurin (PF)
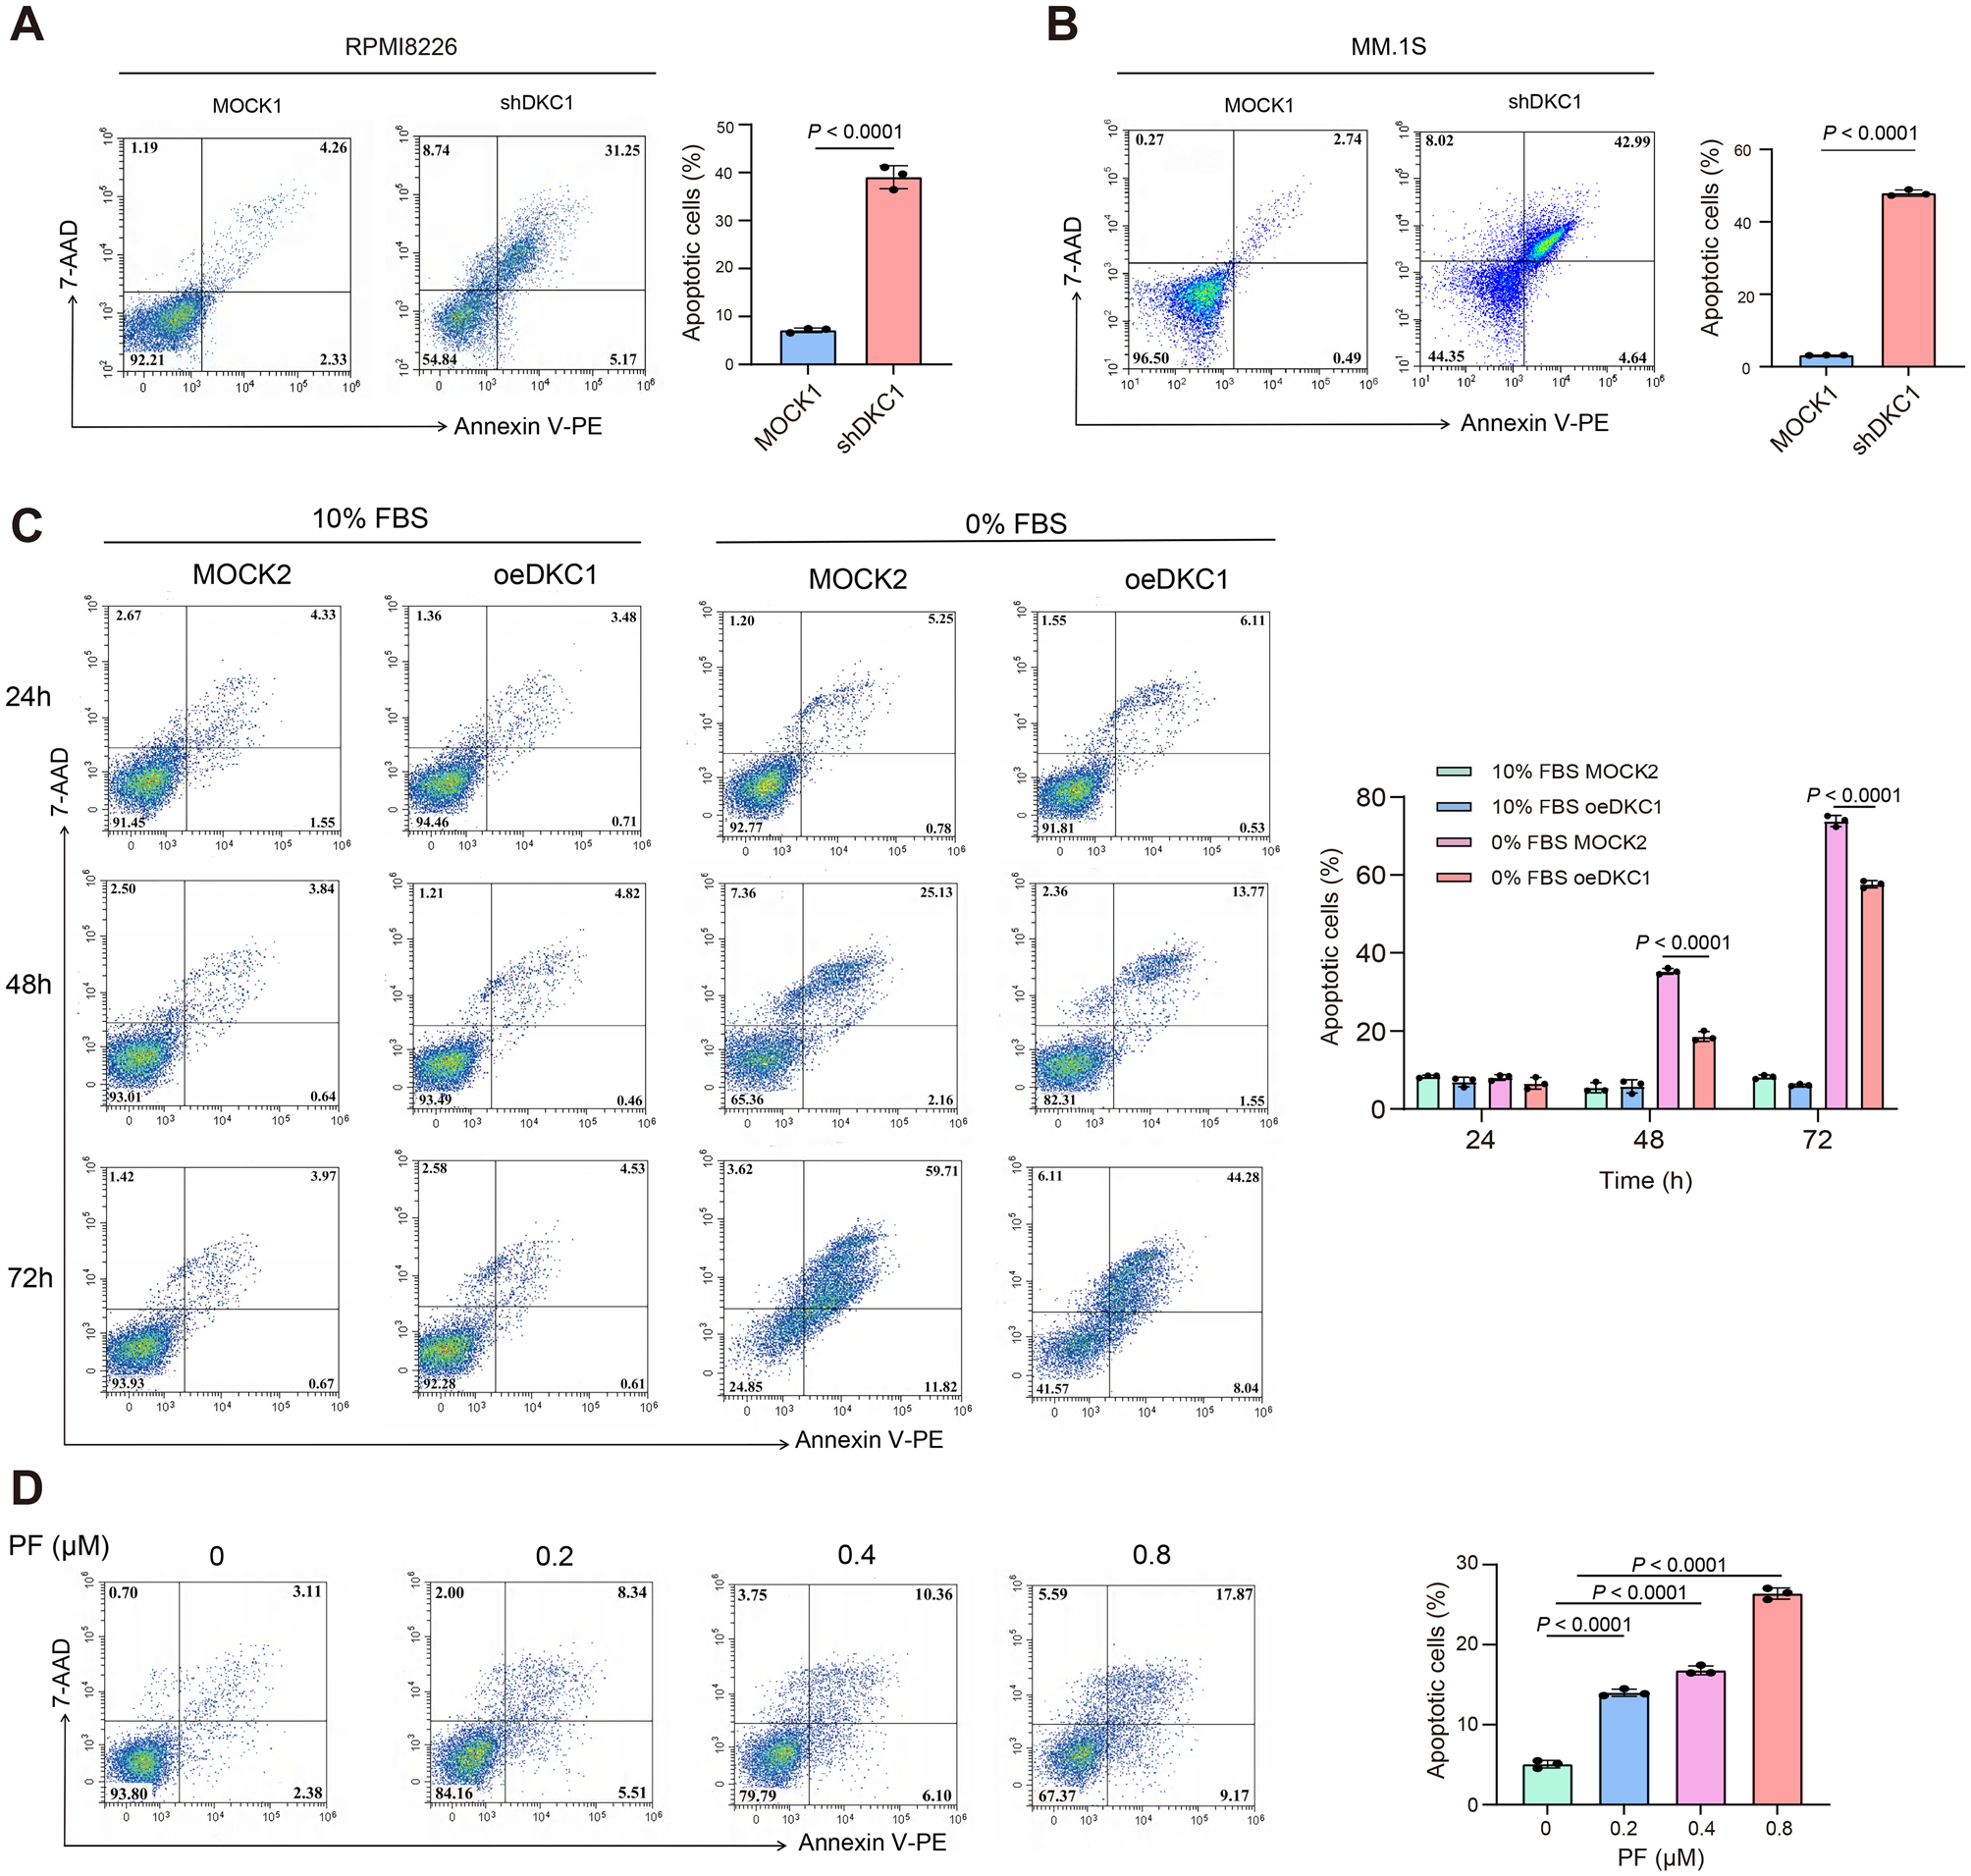
Fig. 3 DKC1 reduces apoptosis of MM cells. A, B Flow cytometric analysis of apoptosis in shDKC1 and MOCK1 MM cells, with (A) RPMI8226 cells and (B) MM.1S cells, using Annexin V and 7-AAD staining. C Flow cytometric analysis of apoptosis in oeDKC1 and MOCK2 MM cells following culture with or without FBS for 24, 48, and 72h. D Apoptosis of RPMI8226 cells was assessed after treatment with PF at 0.2, 0.4, and 0.8μM for 72h, with an equivalent volume of vehicle used as the control (0μM PF). Data are presented as mean±SD from three independent experiments
模块 3:体内异种移植模型验证 DKC 敲除与 PF 药物抑瘤(含 Absin 产品应用)
1、研究逻辑:两种小鼠模型(shDKC 稳转细胞荷瘤、PF 药物干预荧光素酶标记细胞荷瘤),从肿瘤生长、活体发光、组织病理多维度验证体内功能;
2、核心实验:NCG 小鼠皮下成瘤;肿瘤体积 / 重量监测;活体生物发光成像;肿瘤 Ki67 增殖、TUNEL 凋亡 IHC;心肝肾 H&E 脏器毒性染色;
3、关键实验结果:
4、Absin 产品关键使用步骤:构建荧光素酶标记 RPMI8226 细胞荷瘤小鼠,第 7、11 天腹腔注射 3mg / 只 abs42017259 D - 荧光素钾盐,静置后使用 IVIS 活体成像系统采集生物发光信号,定量各组肿瘤整体负荷;
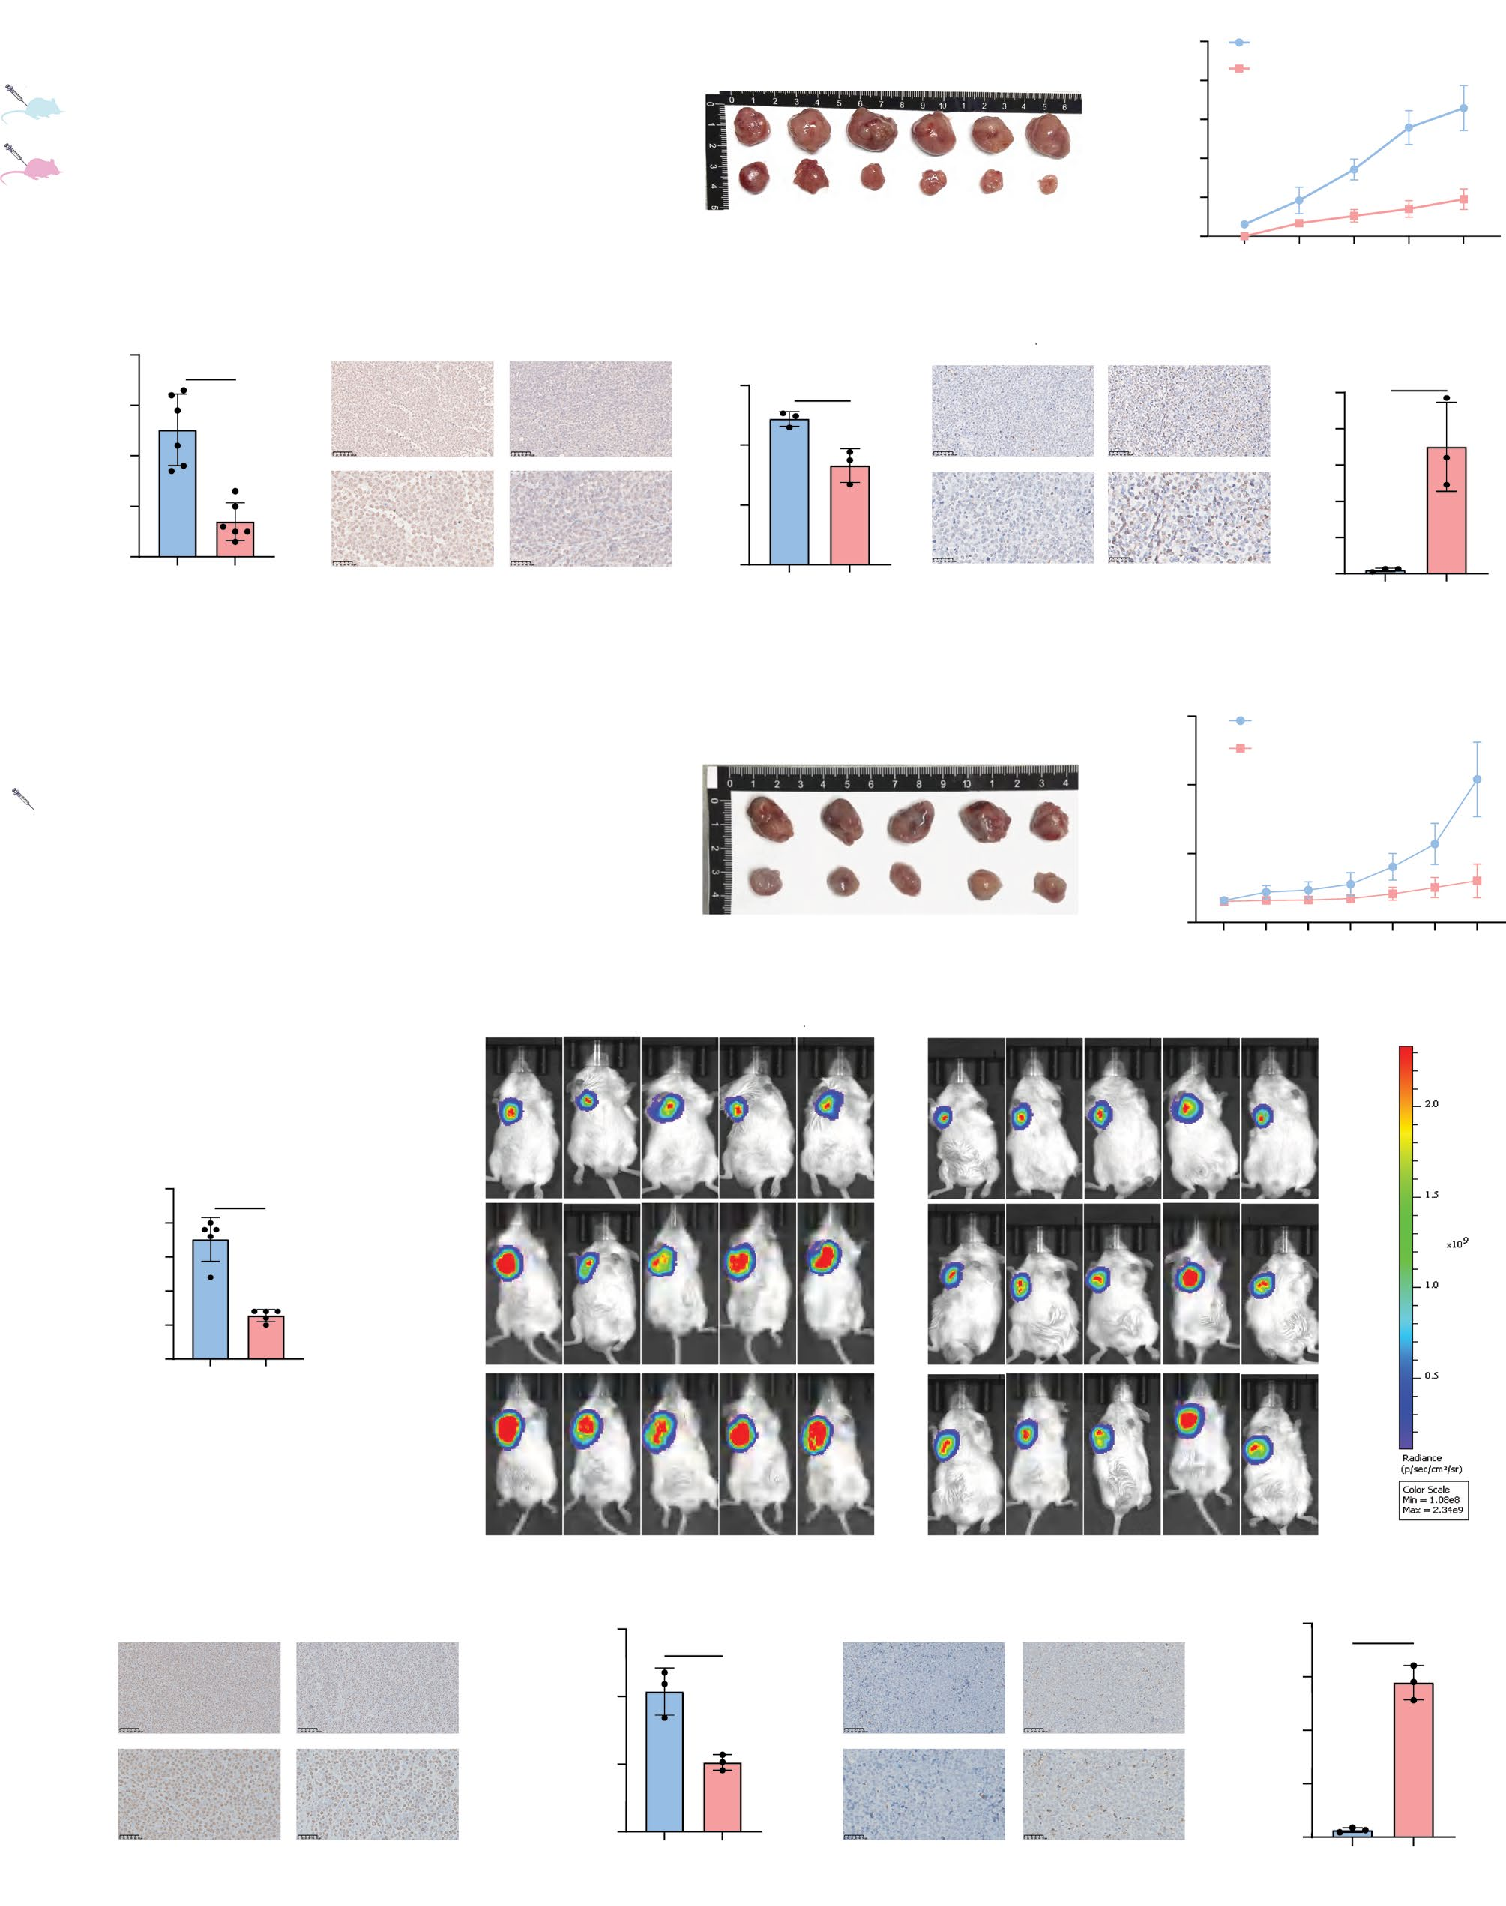
Fig. 4 Both DKC1 knockdown and PF treatment suppress tumor growth in MM mouse model. A Experimental schematic comparing the MOCK1 and shDKC1 groups in the MM mouse model. B-D Representative tumor photographs (B), tumor growth curves (C) and tumor weights (D) in the MOCK1 and shDKC1 groups, with six mice per group. For panels (C), ** indicates p=0.0056 at day 2, **** indicates p<0.0001 at days 4, 6, 8, respectively for MOCK1 (blue) vs shDKC1 (red). E, F Representative immunohistochemical staining of Ki67 (E) and TUNEL (F) in MOCK1 and shDKC1 groups at×20 magnification (scale bar=100μm) and×40 magnification (scale bar=50μm). Data were obtained from 3 mice per group. G Schematic representation of the PF treatment regimen in the MM mouse model. Briefly, MM xenograft models were established and mice were randomized to two groups. Mice in the experimental group received PF (5mg/kg, intraperitoneal injection, every third day), whereas those in the control group were administered vehicle. H-K Representative tumor photographs (H), tumor growth curves (I), tumor weights (J) and bioluminescence monitoring (K) of tumors in PF and vehicle groups, with five mice per group. For panel (I),*indicates p=0.0218 at day 8, **** indicates p<0.0001 at days 10, 12, respectively for vehicle (blue) vs PF (red). L, M Representative immunohistochemical staining of Ki67 (L) and TUNEL (M) in vehicle and PF groups at×20 magnification (scale bar=100μm) and×40 magnification (scale bar=50μm). Data were obtained from 3 mice per group. All quantitative data are presented as mean±SD. Abbreviations: pyrazofurin (PF)
模块 4:转录组筛选并验证下游靶基因 ATF5
1、研究逻辑:DKC 敲除细胞 mRNA 测序,筛选凋亡 + 增殖通路共同差异基因,锁定 ATF5;生信、qPCR、WB 验证 DKC 调控 ATF5 表达;
2、核心实验:RNA-seq 差异分析、GO/KEGG 富集;MMRF 队列基因相关性;RT-qPCR、WB 检测 ATF5;mRNA 半衰期降解实验;RIP 蛋白 RNA 结合实验;
3、关键实验结果:
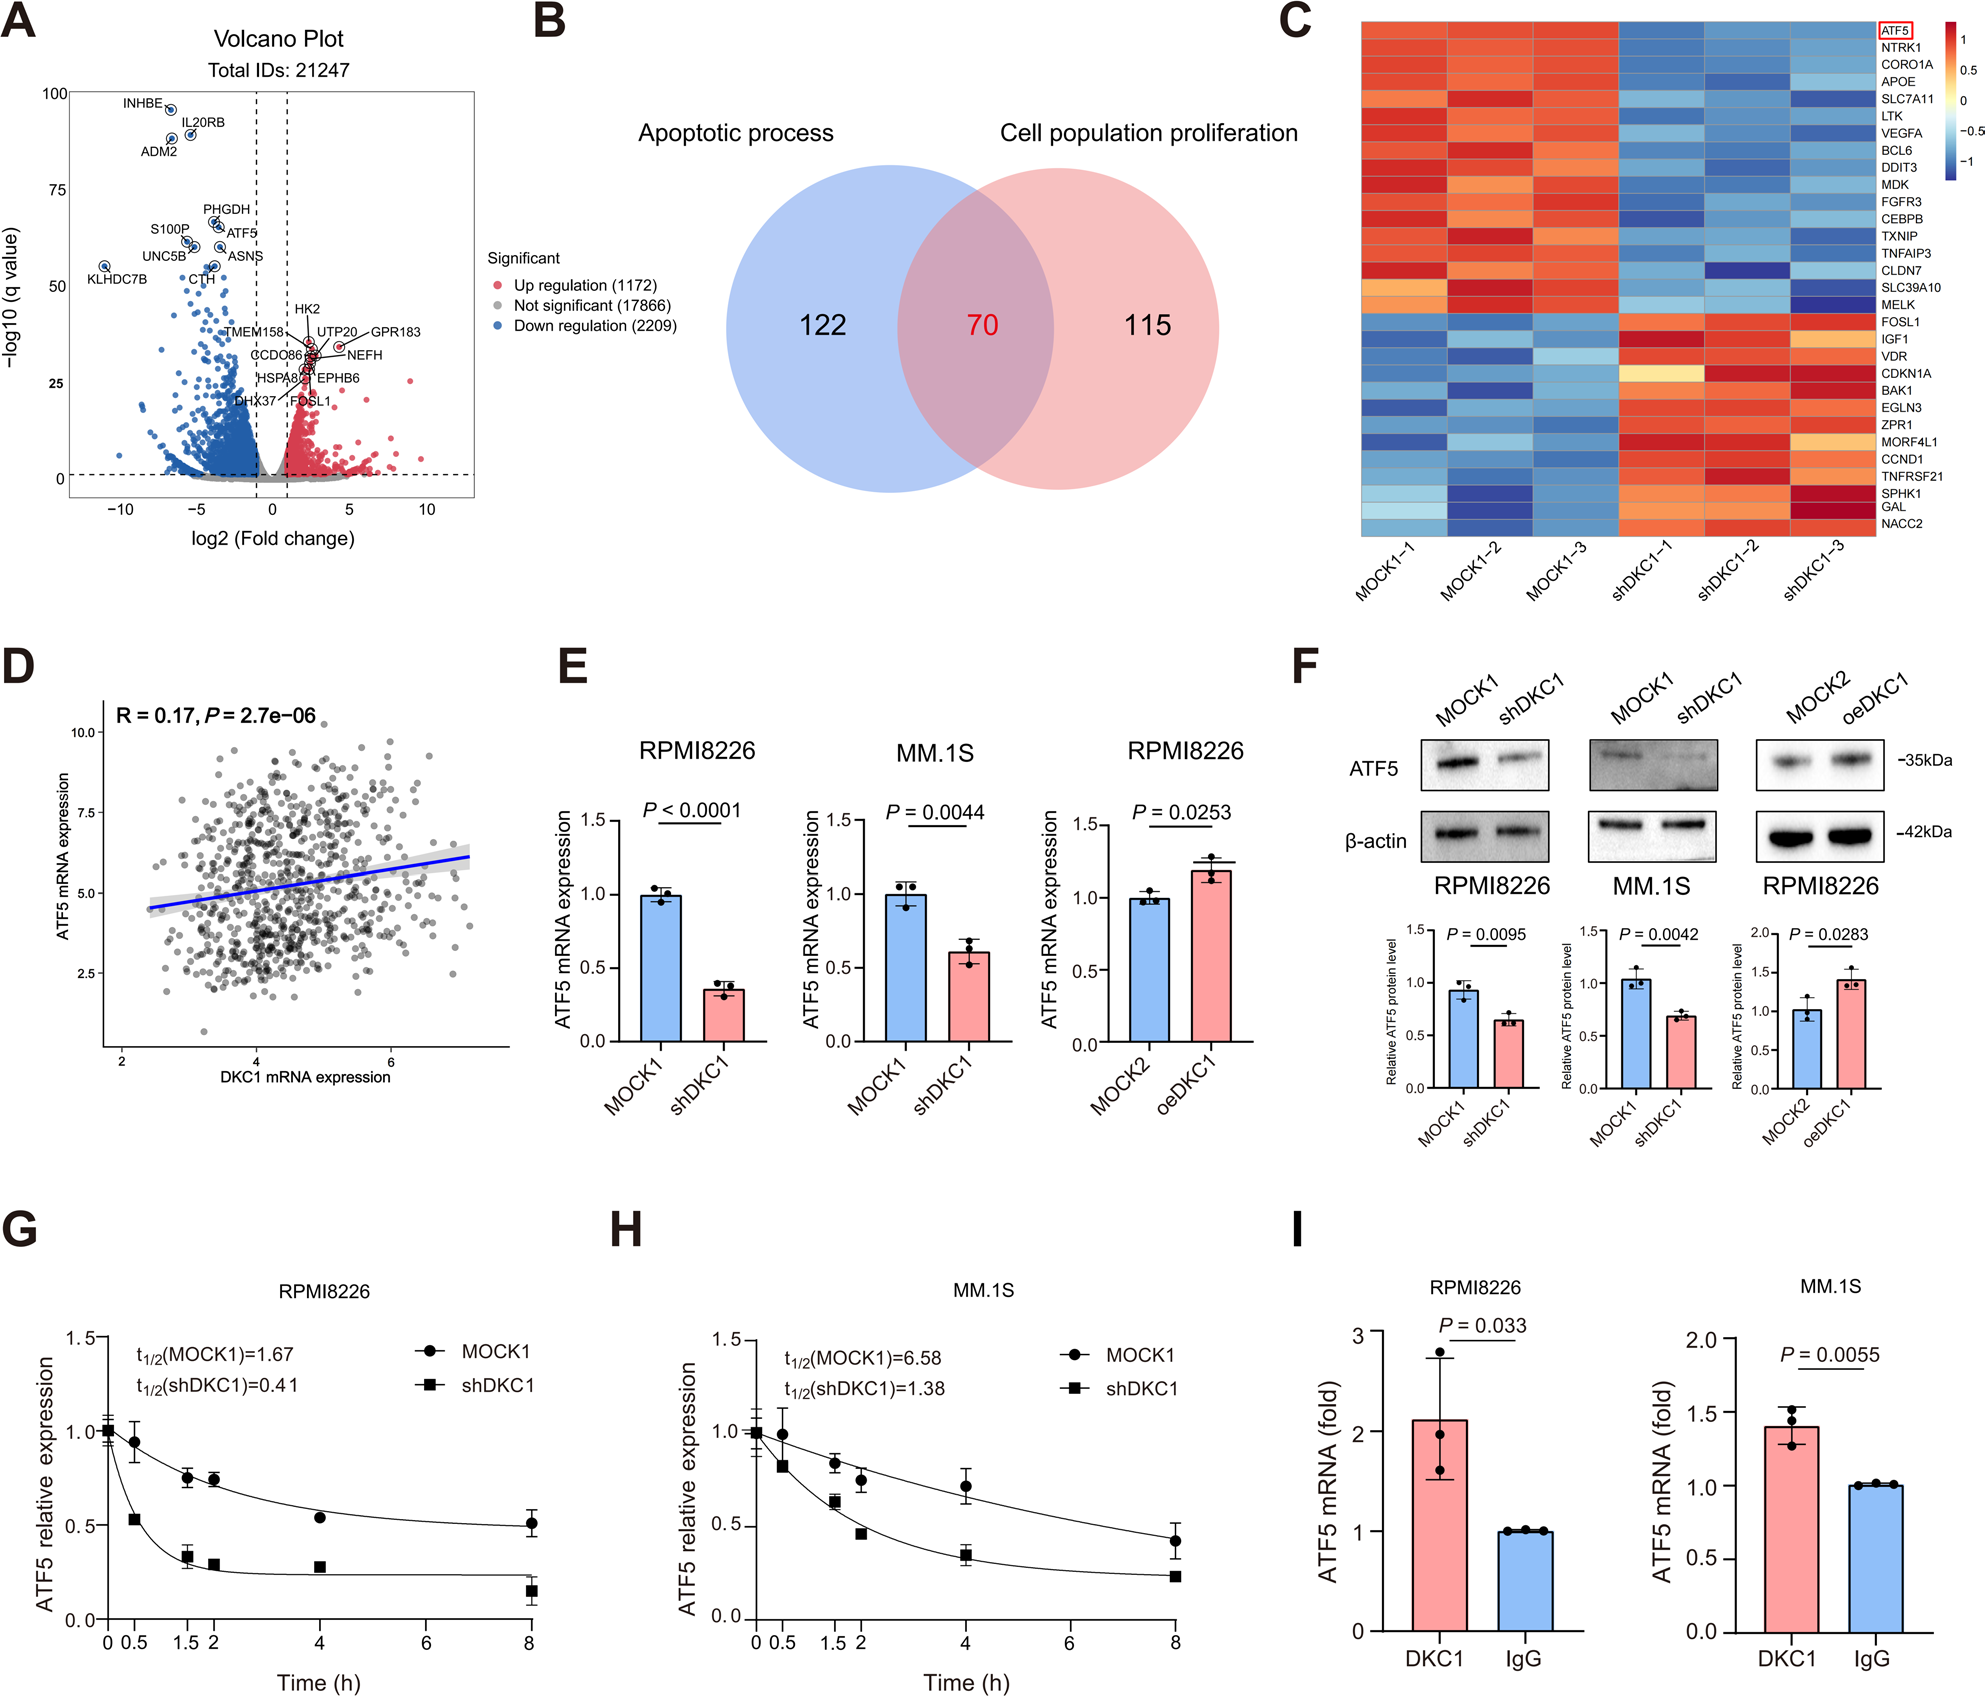
Fig. 5 ATF5 is the potential downstream effector of DKC1 in MM cells. A Volcano plot of differentially expressed mRNAs between MOCK1 and shDKC1 RPMI8226 cells. B Venn diagram showing overlapping genes from GO enrichment analysis between MOCK1 and shDKC1 cells involved in apoptosis and cell proliferation pathways. C Heatmap of the top 30 overlapping genes identified from GO enrichment analysis, shown with three replicates per group. D Scatter plot showing the relationship between ATF5 and DKC1 mRNA expression, using data from the MMRF CoMMpass dataset. E, F ATF5 mRNA expression (E) and ATF5 protein levels (F) in DKC1 knockdown and overexpression cells, compared to their respective control groups. G, H mRNA stability assay showing the decay rate of ATF5 mRNA in MOCK1 and shDKC1 cells. I RIP assay showing DKC1 binding to ATF5 mRNA. Data are presented as mean±SD from three independent experiments, each with three technical replicates (wells) for qPCR. Abbreviations: gene ontology (GO)
模块 5:DKC1 通过 ATF5 mRNA 假尿苷修饰调控通路与回救验证
1、研究逻辑:CMC 法定位 ATF5 mRNA 假尿苷位点;回救实验证明 ATF5 介导 DKC 全部致癌表型,构建完整分子轴
2、核心实验:CMC-qPCR、Mn2+ 依赖 RT 单碱基测序定位 Ψ 位点;ATF5 过表达回救 shDKC、ATF5 敲低逆转 oeDKC;EdU、克隆、凋亡功能回救;WB 检测 Bcl2/Bax;通路机制示意图;
3、关键实验结果:
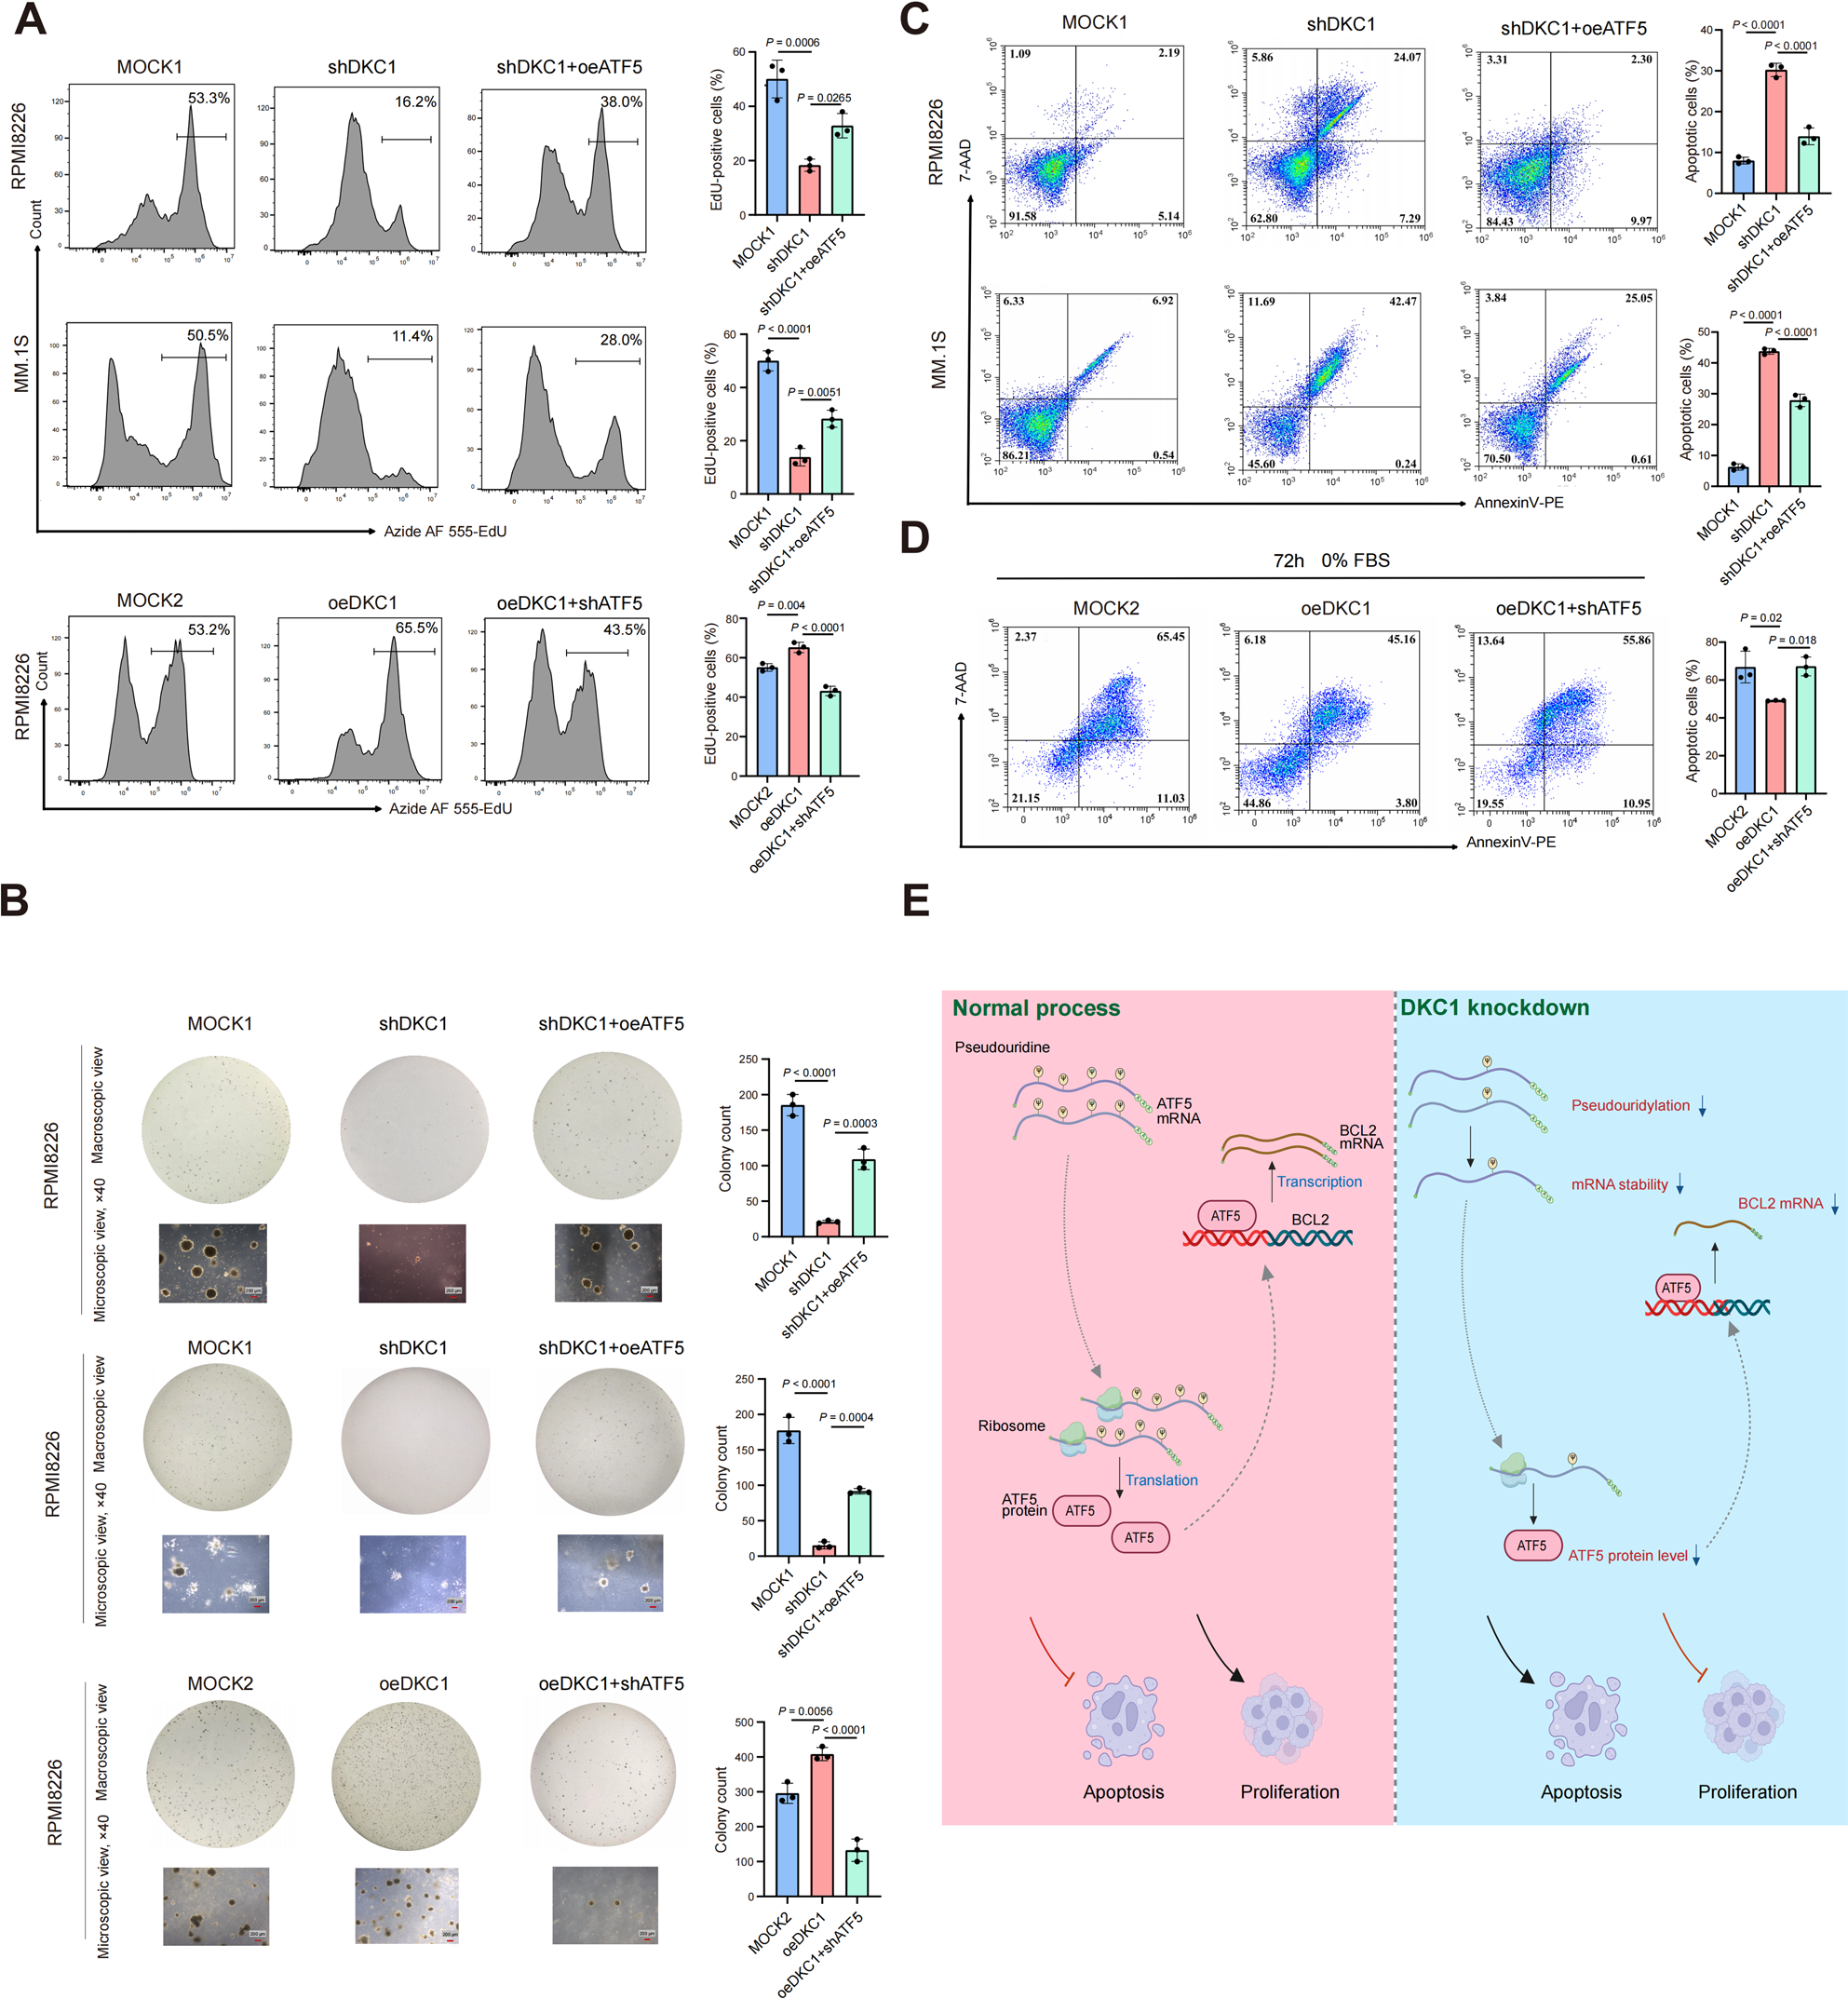
Fig. 6 ATF5 rescues the cellular phenotypes induced by DKC1 knockdown in MM cells. A, B EdU assay (A) and soft agar colony formation assay (B) were performed in MOCK1, shDKC1, and shDKC1+oeATF5 groups, alongside MOCK2, oeDKC1, and oeDKC1+shATF5 groups. C Apoptosis analysis in MOCK1, shDKC1, and shDKC1+oeATF5 groups. D Apoptosis analysis following 72h serum starvation in MOCK2, oeDKC1, and oeDKC1+shATF5 groups. Data are presented as mean±SD from 3 independent experiments. E Model illustrating the DKC1–ATF5-Bcl-2 axis. Reduced DKC1 expression decreases ATF5 mRNA stability, downregulates Bcl-2, and consequently inhibits proliferation while promoting apoptosis in MM cells
五、Absin(abs42017259 D - 荧光素钾盐)产品整体作用总结

- 手机:13761418683