




- 手机:13761418683
联系人:爱必信
网址:http://www.absin.cn/
地 址:上海市浦东新区新浩路58号18号楼

- DDC 饮食诱导小鼠建立稳定 MDB 肝纤维化模型,设置正常 / 给药 / 撤药 / 复药四组,病理染色证实炎症、脂肪变性、胶原沉积、MDB 表型;
- 四组肝脏组织开展 snRNA-seq,总计 35588 个细胞核转录组,分群鉴定 9 大类肝脏细胞,重新聚类细分肝细胞 6 亚群、HSC4 亚群,锁定 MDB 特异性 MAH(Hep4/Hep5)、活化 aHSC;
- 配体 - 受体互作分析筛选出 KCs、aHSC 分泌 HGF 与 MAH 细胞膜 MET 为最强通讯配对,GSVA 证实 MAH 内 PI3K/AKT/NF-κB、STAT3 通路显著富集;
- 使用 Absin abs9516 试剂盒构建 3D MDB 类器官(MDO),建立肝细胞 - 肝星状细胞共培养体系,体外验证 HGF 促纤维化、促 MDB 形成功能;
- 肝癌细胞 Hepa1-6 体外 TNFα/IFNγ 诱导 MDB 表型,HGF 刺激、MET/PI3K 抑制剂阻断正反双向实验,明确下游 NF-κB、STAT3 介导 Ub 转录上调;
- CRISPR 构建 UbD?/?敲除小鼠 DDC 纤维化模型,反向验证 UbD 缺失抑制 HGF/MET 通路、缓解 MDB 与纤维化;
- 公共肝癌队列 TCGA-LIHC、多套小鼠 / 人肝疾病转录数据集验证 MAH 标志物(Slc7a11、K8、UbD、Mmp14)临床预后价值;
- 人 MDB 阳性肝癌活检组织蛋白、免疫荧光检测,证实 HGF/MET/UbD 通路在人类肝病中临床相关性,提出靶向治疗策略。
- DDC 饲喂 / 复药组小鼠肝脏肿大,转氨酶升高,出现显著胆管反应、肝细胞气球样变、脂沉积、胶原纤维、MDB 包涵体;CCl?联合 DDC 可进一步加重纤维化;
- snRNA-seq 分群得到肝细胞、HSC、库普弗细胞等 9 大类细胞;DDD 处理后 KCs、HSC、胆管细胞占比显著上升,肝细胞比例下降;
- 细胞标记基因热图清晰区分各类细胞分群,证实单细胞分群可靠性。
- Hep4、Hep5 在 DDC 处理组比例大幅扩增,高表达 K8、K18、p62、UbD,定义为 MAH;Hep4 富集肝癌、凋亡通路,Hep5 富集氧化磷酸化、神经变性通路;
- CytoTRACE 提示 Hep4 分化程度最低、恶性潜能最高;Hep4 存在 1/6 号染色体拷贝数扩增,基因组不稳定;
- TCGA 肝癌队列中 Hep4 比例越高总生存期越短;Slc7a11 高表达肝癌患者预后差,可作为独立不良预后标志物。
- HSC 分为 4 个亚群,活化 aHSC 在 DDC 组显著增多,高表达 Mmp14、α-SMA,富集 ECM 黏附、EMT、PI3K 炎症通路;
- Mmp14 在 aHSC 特异性高表达,促进 HSC 向肌成纤维细胞转化;人肝癌肿瘤组织 Mmp14、α-SMA 上调,高 Mmp14 提示更差生存期。
- HGF-MET 为 MAH 与 KCs、aHSC 最强互作配对;MDB 肝细胞可激活巨噬细胞大量分泌 HGF;
- Absin 试剂盒构建的 3D MDB 类器官稳定表达 K8、p62、UbD;类器官分泌可溶性因子诱导 HSC 释放 TGFβ1、Mmp14,放大纤维化信号;
- DDC 小鼠、人 MDB 肝癌血清 HGF 浓度显著高于对照。
- HGF 刺激激活 MET 磷酸化,依次激活 AKT、IκB、STAT3,上调 Ub、TNFα;MET 或 PI3K 抑制剂可完全逆转该效应;
- 3D 类器官阻断 MET 后,p-AKT、p-IκB、STAT3、UbD 表达下降,类器官萎缩、MDB 标志物减少;
- UbD 启动子存在 NF-κB p50、STAT3 特异性结合位点,炎症因子协同放大 UbD 转录。
- UbD 敲除显著抑制 MET 表达、降低 HGF 与 TNFα 分泌;纤维化标志物 α-SMA、胶原、Vimentin 大幅下调;
- UbD?/?小鼠肝脏 MDB 包涵体、脂肪沉积、胶原纤维显著减少;CCl?联合损伤下保护效应更突出;
- HSC 活化、EMT 转化被显著抑制,完整证明 UbD 是 HGF/MET 通路下游执行分子。
- 搭建不可替代 3D 病理体外模型:本研究首次建立 DDC 诱导 MDB 类器官(MDO)体系完全依托 Absin abs9516 试剂盒,传统二维细胞无法模拟肝细胞与 HSC 空间旁分泌交互,试剂盒配套培养基、消化缓冲、基质胶配套方案可稳定复刻体内 MDB 蛋白聚集、纤维化因子分泌病理特征;
- 支撑药物干预与通路功能体外验证:试剂盒培养的 MDB 类器官可稳定传代、冻存复苏,重复性强,用于 MET 抑制剂梯度干预实验,直观可视化 HGF/MET 通路阻断后 MDB 形成抑制现象,为体内动物实验提供前置体外药效证据;
- 打通细胞 - 类器官 - 动物多层次实验链条:衔接体外肿瘤细胞、3D 类器官、DDC/UbD 基因小鼠三层体系,完整串联细胞分子机制与体内病理表型,满足 STTT 高分期刊对多层次模型验证的严苛要求,为 HGF/MET/UbD 作为肝病靶点结论提供关键体外类器官数据支撑。
文献深度解析:通过单细胞转录组解析马洛里 - 登克小体相关肝纤维化发病过程中的 HGF/MET 信号轴
2026-08-13
一、文献基础综述
(一)期刊、基础信息
期刊:Signal Transduction and Targeted Therapy(STTT,信号转导与靶向治疗) 2026 最新 IF=81.2
DOI:10.1038/s41392-026-027224
完整标题:Unraveling the HGF/MET axis in Mallory-Denk body pathogenesis associated with liver fibrosis through single-cell transcriptomics
(二)全文核心结论
1.利用单核转录组(snRNA-seq)首次解析马洛里 - 登克小体(MDB)纤维化肝脏单细胞图谱,鉴定两类 MDB 相关肝细胞 MAH(Hep4/Hep5)、4 种肝星状细胞(HSC)亚群,证实 MAH 与肝细胞癌(HCC)进展高度相关,Slc7a11 为肝癌不良预后标志物;
2.明确肝内巨噬细胞(KCs)- 活化肝星状细胞(aHSC)-MAH细胞通讯轴核心通路为 HGF/MET;aHSC、KCs 分泌 HGF 结合 MAH 细胞膜 MET 受体,激活 PI3K/AKT/NF-κB、STAT3 双重下游信号;
3.HGF/MET 通路持续激活上调 UbD,诱导促炎因子 TNFα 释放,形成 “HGF-TNFα” 正反馈环路,驱动 MDB 蛋白聚集体形成;同时 aHSC 受通路调控分泌 TGFβ1,加剧肝纤维化;
4.UbD 基因敲除(UbD?/?)小鼠模型可显著抑制 HGF/MET 信号、阻断 MDB 生成、减轻胶原沉积与肝纤维化;人 MDB 肝癌样本中 HGF/MET、UbD 通路显著高表达;
5.首次构建 DDC 诱导 3D MDB 肝类器官(MDO)体外模型,完整复刻 MDB 病理特征,证实 HGF/MET/UbD 轴是慢性肝病、肝纤维化、肝癌联合潜在治疗靶点。
(三)Absin 产品作用简述
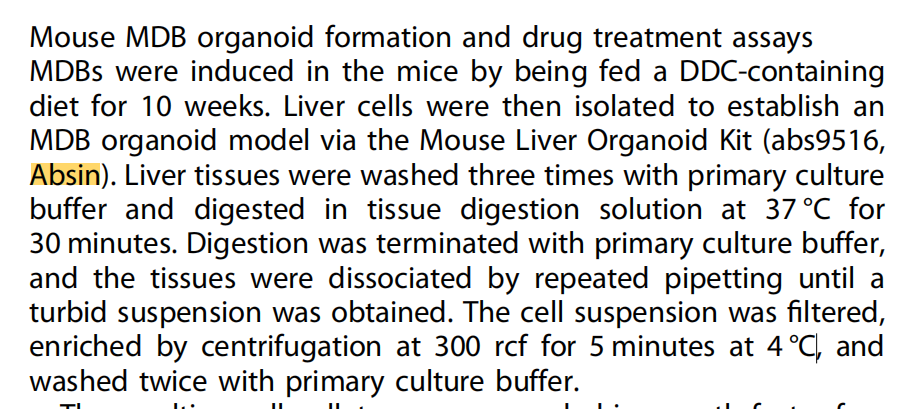
本研究采用abs9516 小鼠肝脏类器官培养试剂盒搭建 3D MDB 类器官体外病理模型,替代传统二维细胞系还原肝脏细胞互作微环境,为通路功能验证提供类器官核心培养体系;依托该试剂盒实现类器官稳定传代、冻存复苏,支撑 MET 抑制剂药物干预实验的数据产出。
二、研究领域背景介绍
慢性肝病(酒精性肝炎、代谢相关脂肪性肝炎 MASH、肝纤维化、肝癌)进程中普遍存在 MDB 蛋白包涵体,MDB 是肝细胞角蛋白 K8/K18、p62 泛素蛋白异常聚集产物,直接关联肝细胞气球样变、炎症、纤维化恶变,但驱动 MDB 形成的肝内细胞交互网络、核心分子通路长期不清晰。
肝星状细胞 HSC 是肝纤维化胶原主要来源,静息 HSC 激活为 aHSC 后大量分泌 ECM、促纤维化因子;库普弗细胞 KCs 是肝脏固有巨噬细胞,二者与损伤肝细胞形成复杂旁分泌调控网络,但 MDB 发生时三者间配体 - 受体通讯机制缺乏单细胞分辨率证据。
HGF/MET 通路经典功能为肝细胞修复再生,但在 MDB 相关纤维化中的双向调控、上下游级联分子(UbD)未知;既往研究仅使用批量转录组,无法区分异质性肝细胞、HSC 亚群功能差异,且缺少可稳定传代的体外 MDB 病理模型限制机制验证。
基于上述空白,本研究依托 snRNA-seq 单细胞技术、DDC 小鼠体内模型、Absin 小鼠肝类器官试剂盒构建 3D 体外 MDB 体系,联合 UbD 敲除基因动物,完整解析 MDB 发生、纤维化进展的 HGF/MET/UbD 分子调控轴。
三、作者整体递进研究思路总结
全文遵循动物病理建模→单细胞图谱绘制→细胞互作筛选核心通路→3D 类器官体外验证→细胞分子机制解析→基因敲除体内回证→人临床样本转化验证完整 8 层转化逻辑链:
四、分模块详细研究思路、实验结果、对应原文图片
模块 1:DDC 小鼠 MDB 纤维化模型构建 + 肝脏单细胞图谱绘制
1.研究逻辑:DDC 诱导建立体内 MDB 模型,多组病理染色确认纤维化、MDB 病变;snRNA-seq 解析全肝脏细胞异质性,明确疾病进程中细胞比例变化。
2.核心实验:H&E、Masson、油红 O、α-SMA/F4/80 免疫组化;ALT/AST/ALP 血清生化;snRNA-seq 建库、UMAP 聚类、细胞比例统计;差异基因热图、小提琴标记基因图。
3.关键实验结果:
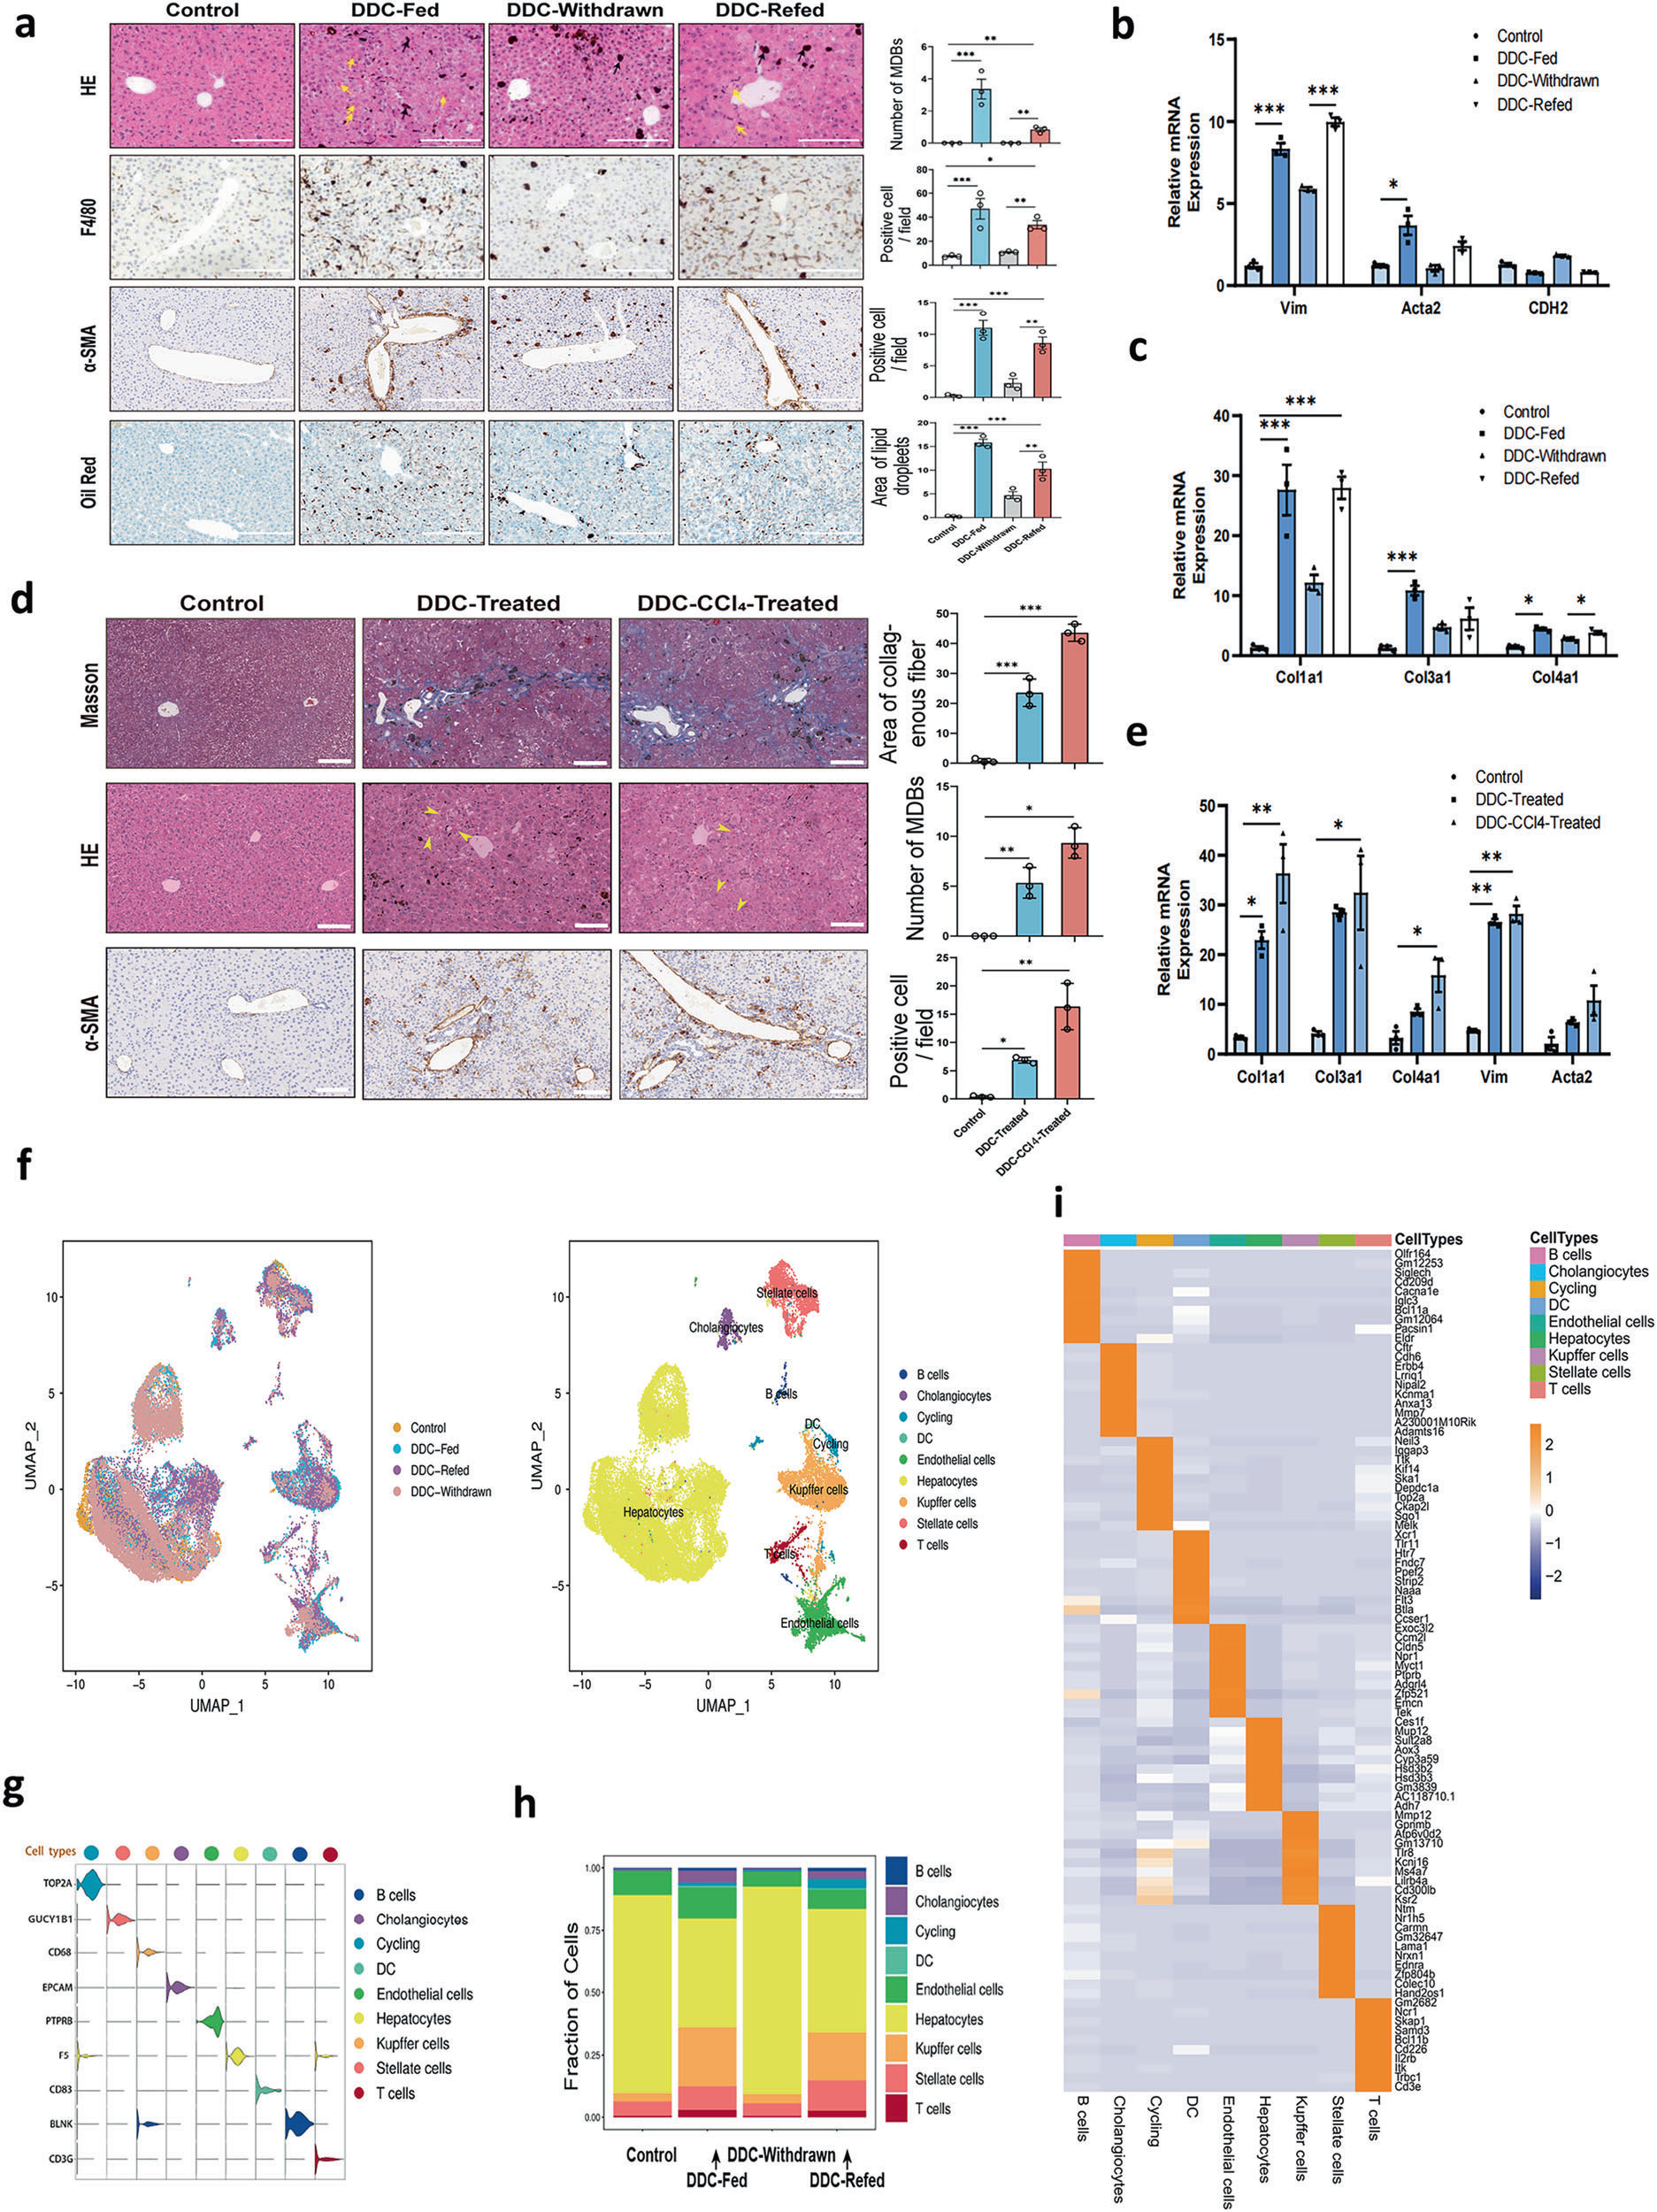 Fig. 1 MDB pathogenesis is associated with liver fibrosis and cellular heterogeneity. a Liver fibrosis, lipid deposition, and macrophage activation (F4/80) were assessed in the four groups via H&E, Masson, Oil Red O, and α-SMA IHC staining. Brown pigment deposition (black arrow) and MDBs (yellow arrow) were evident in MDB-forming livers. Scale bar: 100 μm. Images were captured at ×20 magnification. Three mice per group were quantified, with 3 fields analyzed per mouse. b, c RT?qPCR analysis of fibrosis markers (Acta2, Cdh2, and Vim) and collagen genes (Col1a1, Col3a1, and Col4a1) in liver homogenates. d Representative Masson, α-SMA and H&E staining showing fibrosis and MDB formation (yellow arrows). Scale bar: 100 μm; ×20 magnification. Quantification was performed as in (a). e RT?qPCR analysis of fibrosis related genes. f UMAP plots of the single-cell atlas from four groups showing nine major cell types categorized by sample origin (top) and cell type identity (bottom). g Violin plots showing marker gene expression for the nine cell types. h Bar plots of cell type proportions across samples. i Heatmap of the top DEGs (Wilcoxon test) for each cell type. The data are presented as the means ± SEMs; n = 3 mice per group. *p < 0.05; **p < 0.01; ***p < 0.001
模块 2:鉴定 MDB 特异性肝细胞亚群 MAH(Hep4/Hep5)及其肝癌预后关联
1.研究逻辑:肝细胞亚群重聚类,筛选高表达 MDB 标志物(K8/K18/Sqstm1/UbD)细胞亚群;分化潜能、拷贝数变异 CNV、公共肝癌队列生存分析关联肿瘤进展。
2.核心实验:肝细胞亚群 UMAP 重分群、比例统计;MDB 标志物小提琴图;CytoTRACE 分化潜能分析;InferCNV 基因组不稳定性分析;TCGA-LIHC 队列反卷积、KM 生存曲线;多公共数据集基因表达验证。
3.关键实验结果:
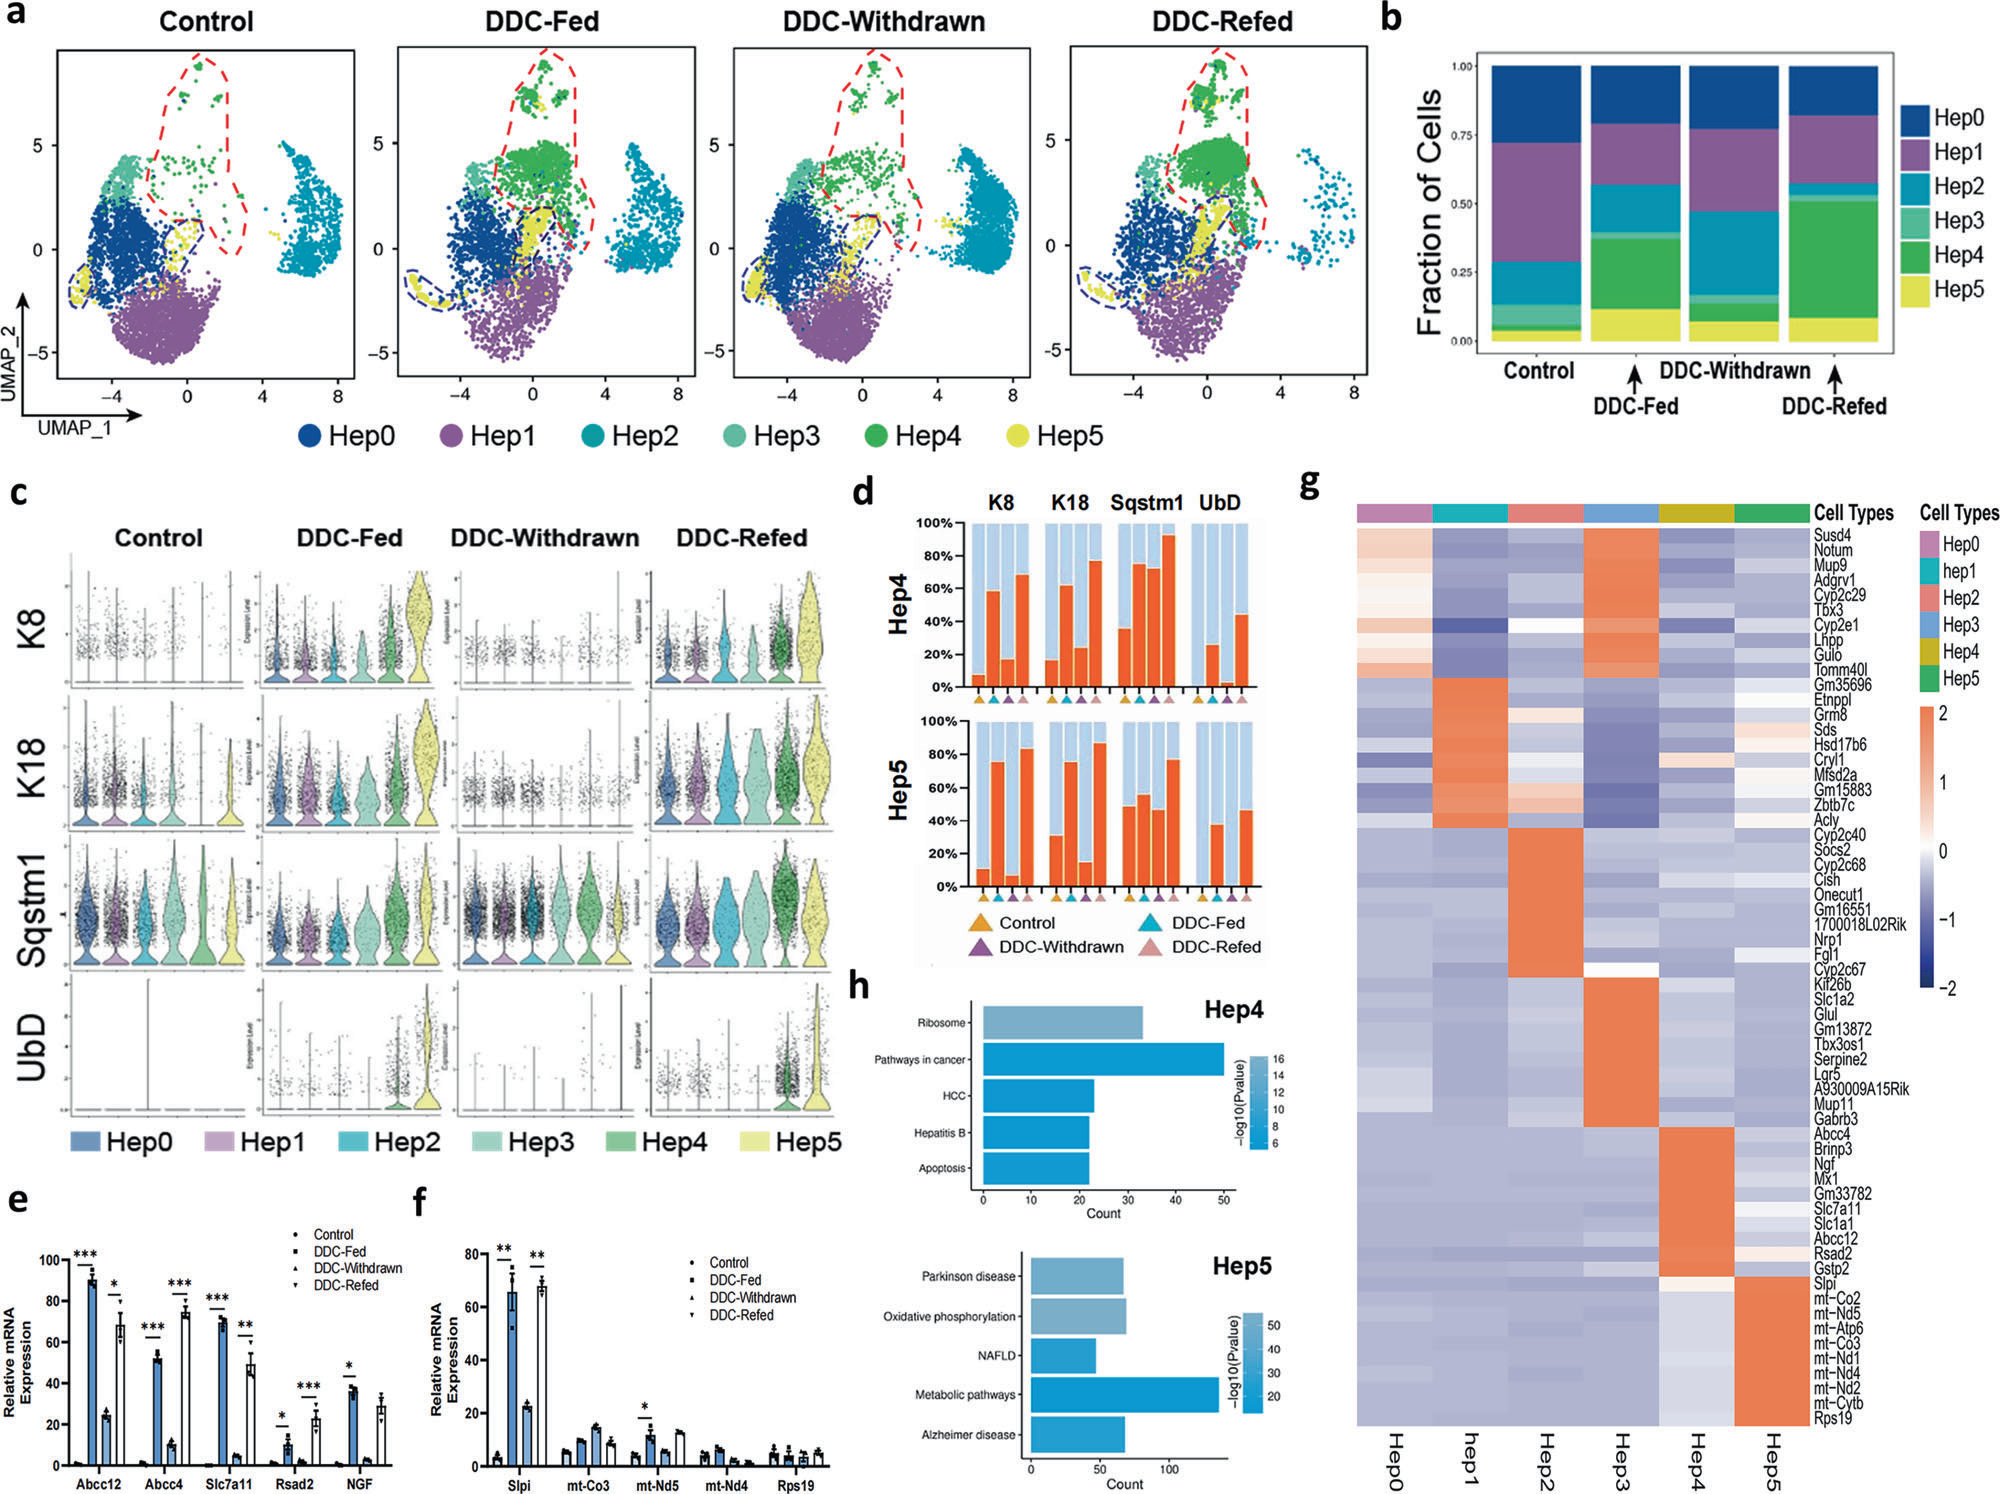 Fig. 2 Emergence and molecular signature of MDB-associated hepatocytes (MAHs). a UMAP plots showing six hepatocyte subclusters across the control, DDC-Fed, DDC-Withdrawn, and DDC-Refed groups. b Bar plots of hepatocyte subcluster proportions in each group. c Violin plots of MDB marker gene expression across clusters. d Expression patterns of K8, K18, Sqstm1, and UbD in Hep4 (top) and Hep5 (bottom) cells across groups. e, f RT?qPCR validation of the expression of selected genes in Hep4 and Hep5 cells from DDC-treated versus control livers. g Heatmap of the top 10 DEGs (Wilcoxon test) across hepatocyte clusters. h KEGG enrichment of DEGs in Hep4 (top) and Hep5 (bottom) cells; adjusted p < 0.05. The data are shown as the means ± SEMs (n = 3). *p < 0.05; **p < 0.01; ***p < 0.001
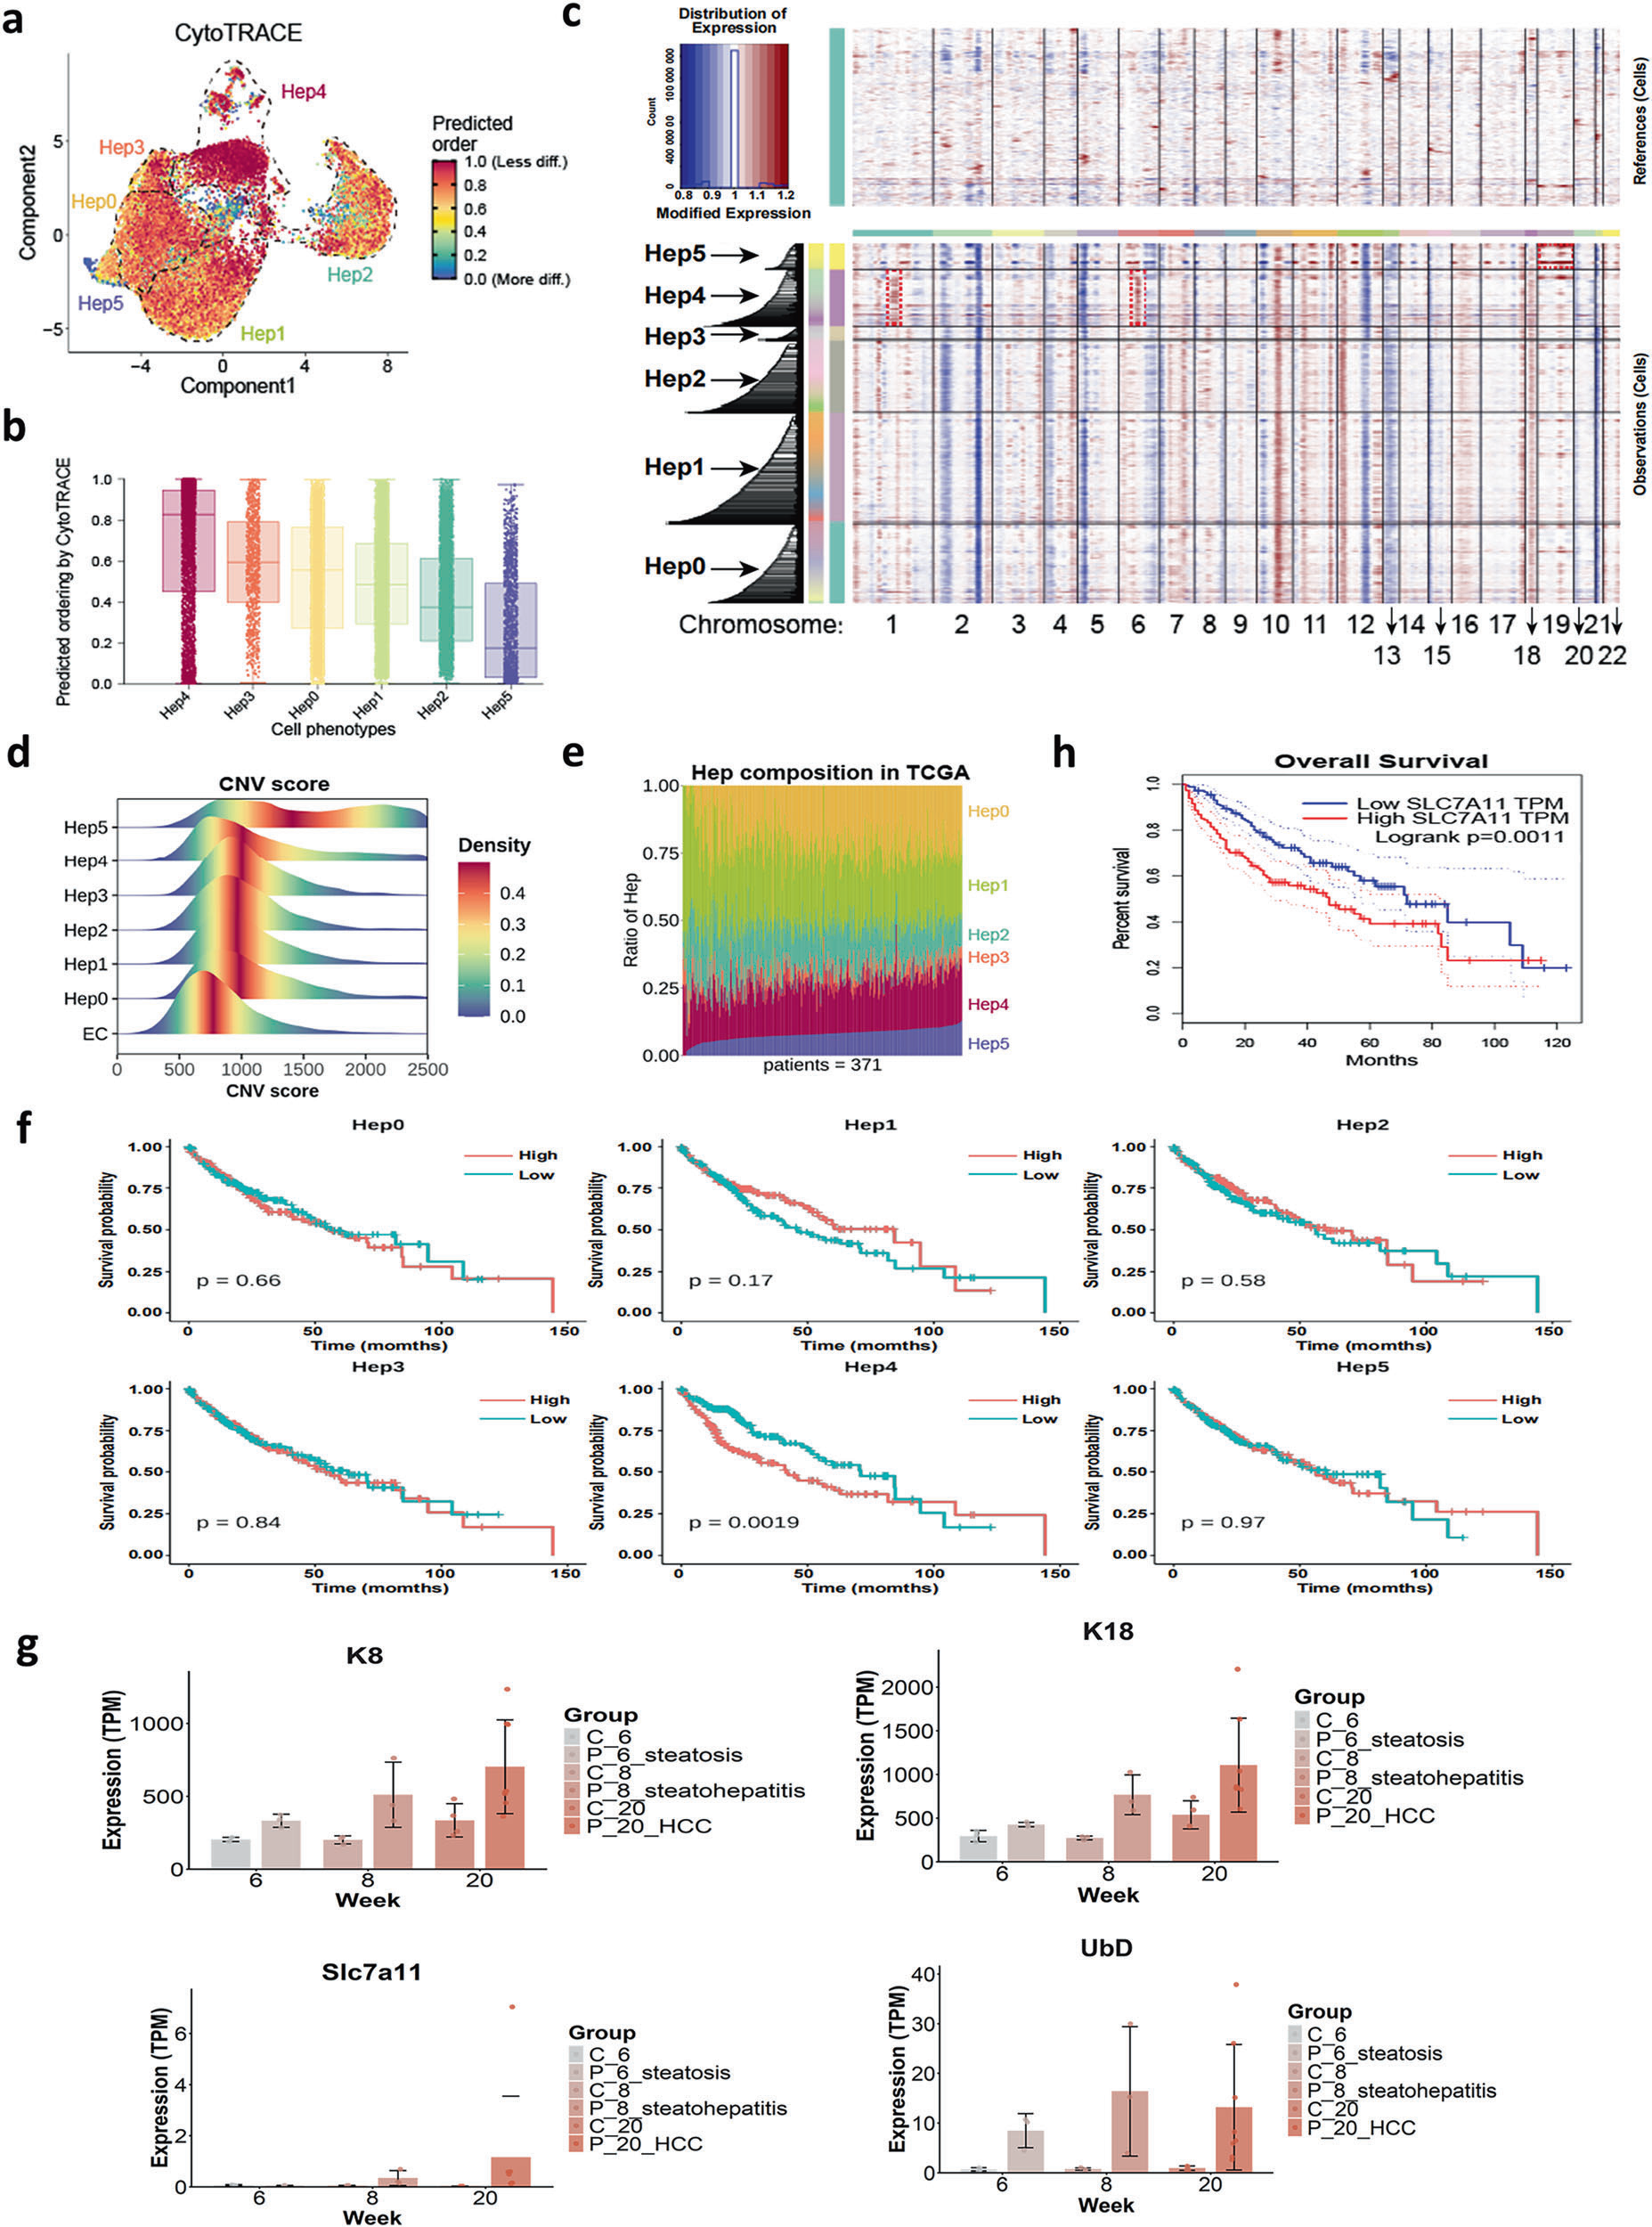 Fig. 3 The MAH subset is closely associated with HCC progression. a, b CytoTRACE analysis showing the differentiation states of hepatocyte subsets, ordered from mature (low values) to immature (high values). c, d CNV profiles and distribution scores inferred by InferCNV across hepatocyte subsets and endothelial cells. e Hepatocyte subset composition (Hep0–Hep5) in HCC patients (TCGA-LIHC). f Kaplan–Meier survival analysis of hepatocyte subsets. g Expression of K8, K18, Slc7a11, and UbD across liver disease stages in a public database. h Kaplan–Meier survival analysis of Slc7a11 expression in TCGA-LIHC cohort
模块 3:肝星状细胞 HSC 亚群异质性,aHSC 促纤维化标志物 Mmp14 临床验证
1.研究逻辑:HSC 重聚类区分静息 / 活化亚群;通路富集明确 aHSC 纤维化、EMT 功能;临床肝癌样本验证 Mmp14 预后价值。
2.核心实验:HSC 亚群 UMAP、标记基因小提琴图;KEGG/GSEA 通路富集;Mmp 家族气泡图;WB、qPCR 验证;人肝癌组织免疫印迹、GEPIA 生存分析。
3.关键实验结果:
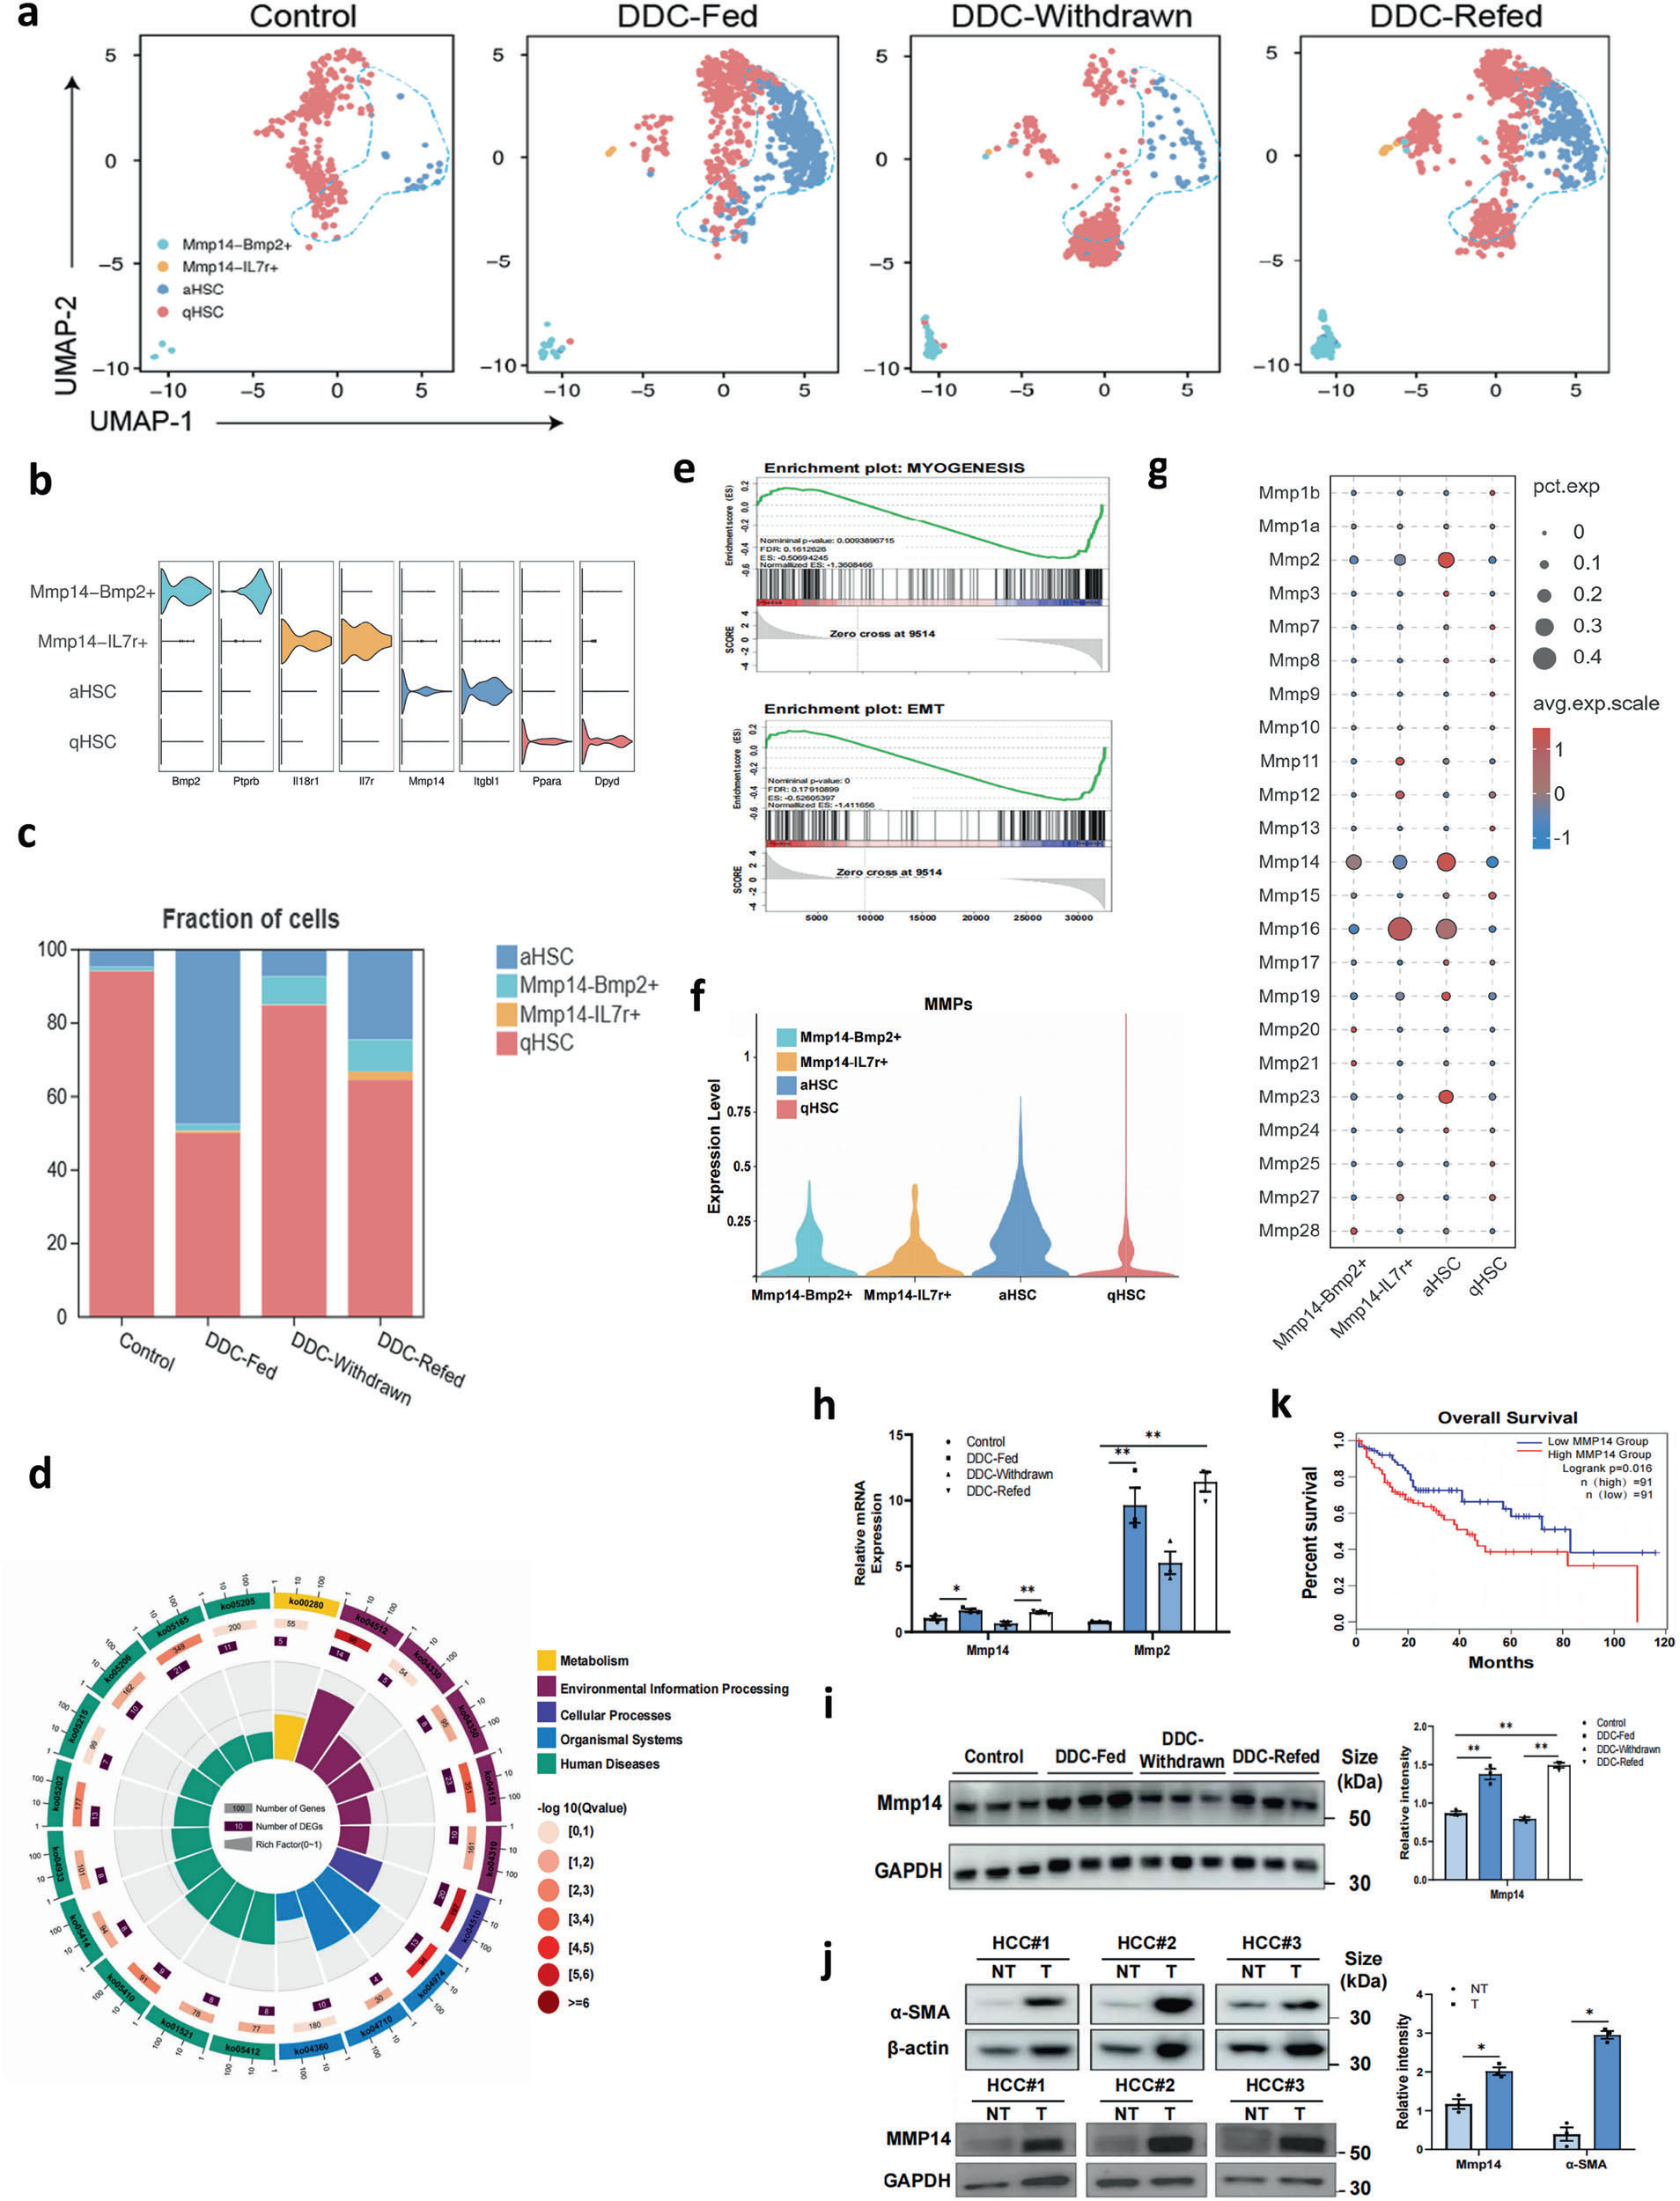 Fig. 4 Single-cell analyses identify distinct HSC populations in MDB livers. a UMAP visualization showing aHSC, qHSC, Mmp14-Bmp2?, and Mmp14-Il7r? subpopulations in control, DDC-Fed, DDC-Withdrawn, and DDC-Refed livers. b Violin plots of marker genes for each subcluster. c Contribution of each group to the HSC subclusters. d KEGG circular plot of enriched pathways in aHSCs from DDC-Fed livers. e GSEA of EMT and myogenesis in aHSCs versus other clusters. f, g Violin plots and bubble maps of Mmp gene expression across HSC subsets. h RT?qPCR validation of Mmp14 and Mmp2 expression in control vs DDC-treated livers. i Western blot analysis of Mmp14 in DDC and control mice. j Western blot of MMP14 and α-SMA in paired tumor and nontumor tissues from HCC patients. k Kaplan–Meier survival analysis of LIHC patients stratified by Mmp14 expression (TCGA, GEPIA). The data are shown as the means ± SEMs (n = 3). *p < 0.05; **p < 0.01; ***p < 0.001
模块 4:细胞互作筛选 HGF/MET 核心通路 + Absin 3D MDB 类器官体外模型验证
1.研究逻辑:配体 - 受体互作筛选 KCs/aHSC 与 MAH 核心通讯分子;使用 Absin abs9516 小鼠肝类器官试剂盒构建 3D MDB 体外模型,共培养验证肝细胞 - HSC 旁分泌互作。
2.核心实验:细胞间配体受体热图、互作气泡图;巨噬 - 肝细胞共培养 HGF ELISA;Absin 试剂盒 3D 类器官培养、传代冻存;类器官与 JS-1 肝星状细胞直接 / 间接共培养;TGFβ1、Mmp14、HGF 分泌 ELISA。
3.Absin 产品关键实验步骤:采用 Absin abs9516 小鼠肝脏类器官培养试剂盒,消化 DDC 诱导 MDB 小鼠原代肝细胞,基质胶包埋构建 3D MDB 类器官;试剂盒配套完全培养基支持类器官稳定扩增、7-9 天传代,冻存复苏后仍保留 MDB 标志物表达;用于 MET 抑制剂药物干预、HSC 共培养功能实验。
4.关键实验结果:
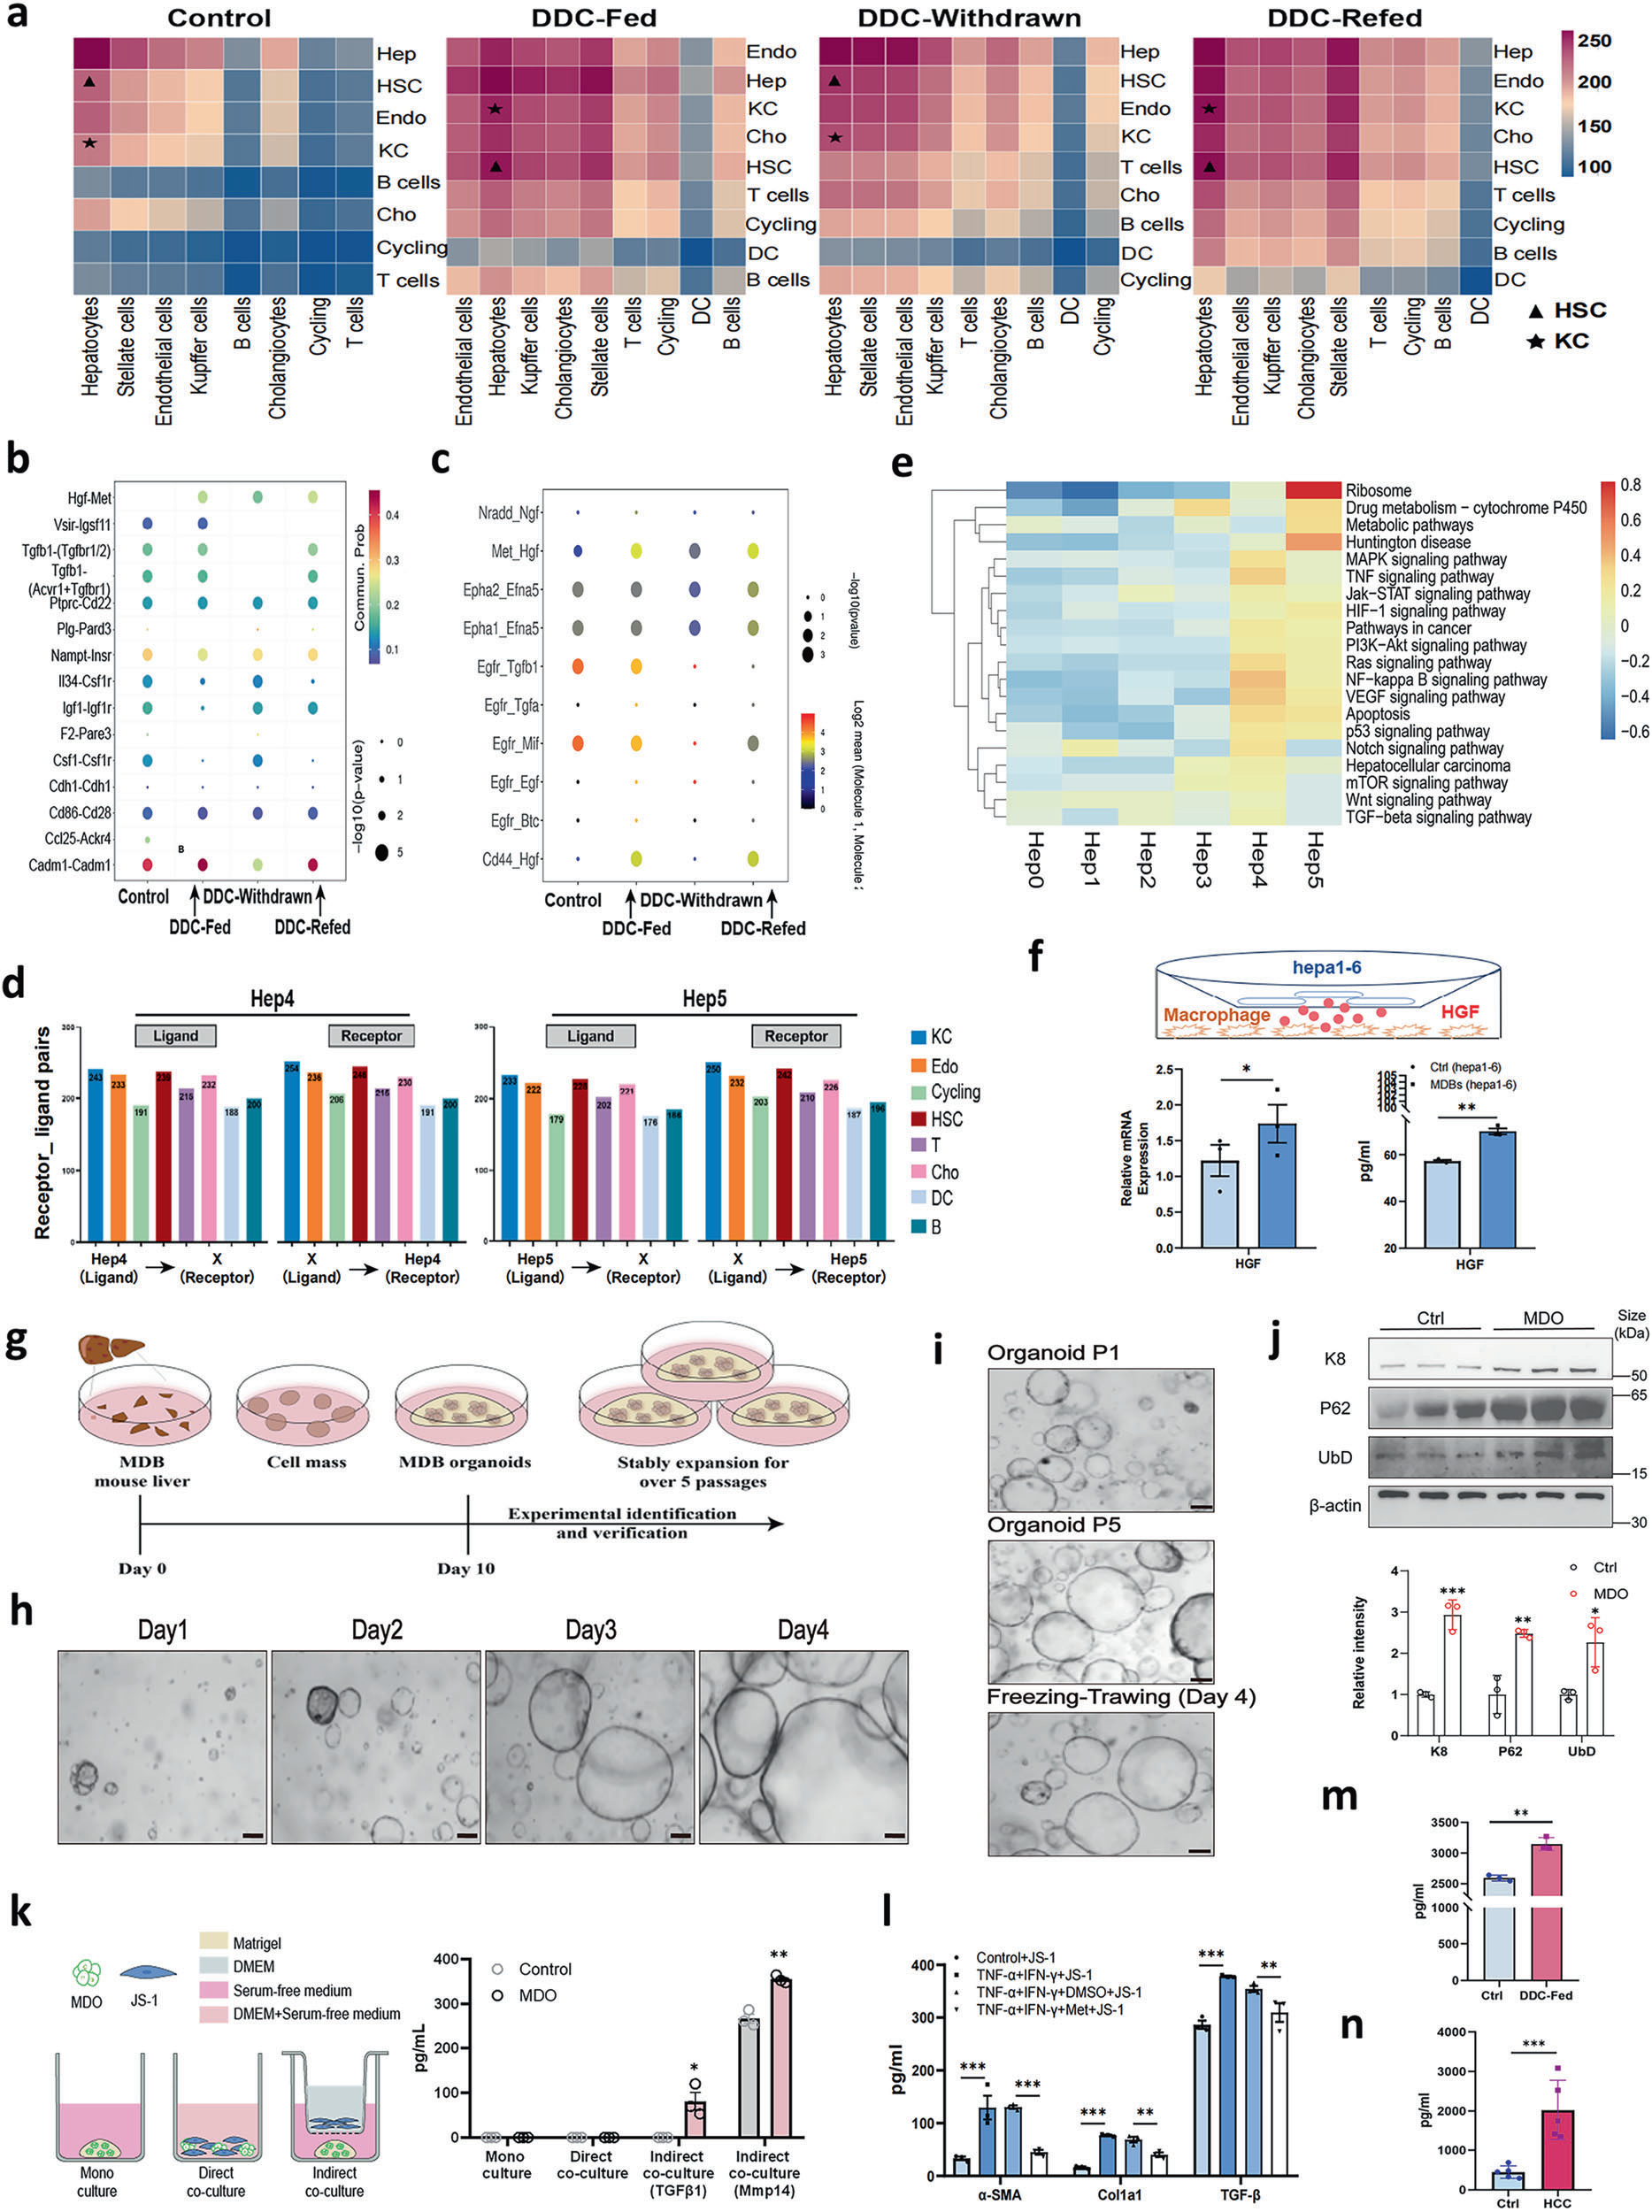 Fig. 5 Enrichment of the HGF/MET axis during MDB pathogenesis. a Heatmap of ligand–receptor interactions between hepatocytes and HSCs/KCs in DDC-Fed and DDC-Refed livers. b, c Dot plots of enriched ligand?receptor interactions between hepatocytes and KCs (b) or aHSCs (c). d Bar plot of receptor–ligand interactions between Hep4/Hep5 cells and the indicated cell types. e GSVA of enriched pathways in hepatocyte subclusters. f RT?qPCR and ELISA results showing HGF expression in Raw264.7 cells cocultured with MDB-forming Hepa1-6 cells. g Experimental schematic of mouse MDB organoid (MDO) cultures. h, i Representative images of DDC-induced MDOs across time points (h) and passages (i). Scale bar: 100 μm. j Western blot of K8, UbD and p62 in organoids from control vs DDC-Fed mice. k ELISA of TGFβ1 and Mmp14 in coculture supernatants from direct and indirect MDO–JS-1 coculture systems. l ELISA analysis of TGFβ1, α-SMA, and Col1a1 secretion in coculture supernatants. m, n ELISA of HGF secretion in mouse serum (n = 3) and HCC samples (n = 5). The data are shown as the means ± SEMs (n = 3 or 5). *p < 0.05; **p < 0.01; ***p < 0.001
模块 5:HGF/MET 通过 PI3K/AKT-NFκB、STAT3 通路上调 UbD 驱动 MDB 形成
1.研究逻辑:HGF 刺激、MET/PI3K 抑制剂阻断正反实验,蛋白磷酸化验证下游通路;3D 类器官免疫荧光验证通路活性;明确 NF-κB、STAT3 结合 UbD 启动子促进转录。
2.核心实验:Hepa1-6 细胞 TNFα/IFNγ 造模;梯度 HGF 给药、抑制剂干预;MET/AKT/IκB/STAT3 磷酸化 WB;MDB 类器官 MET 抑制剂处理免疫荧光;UbD 启动子转录结合位点生信预测。
3.关键实验结果:
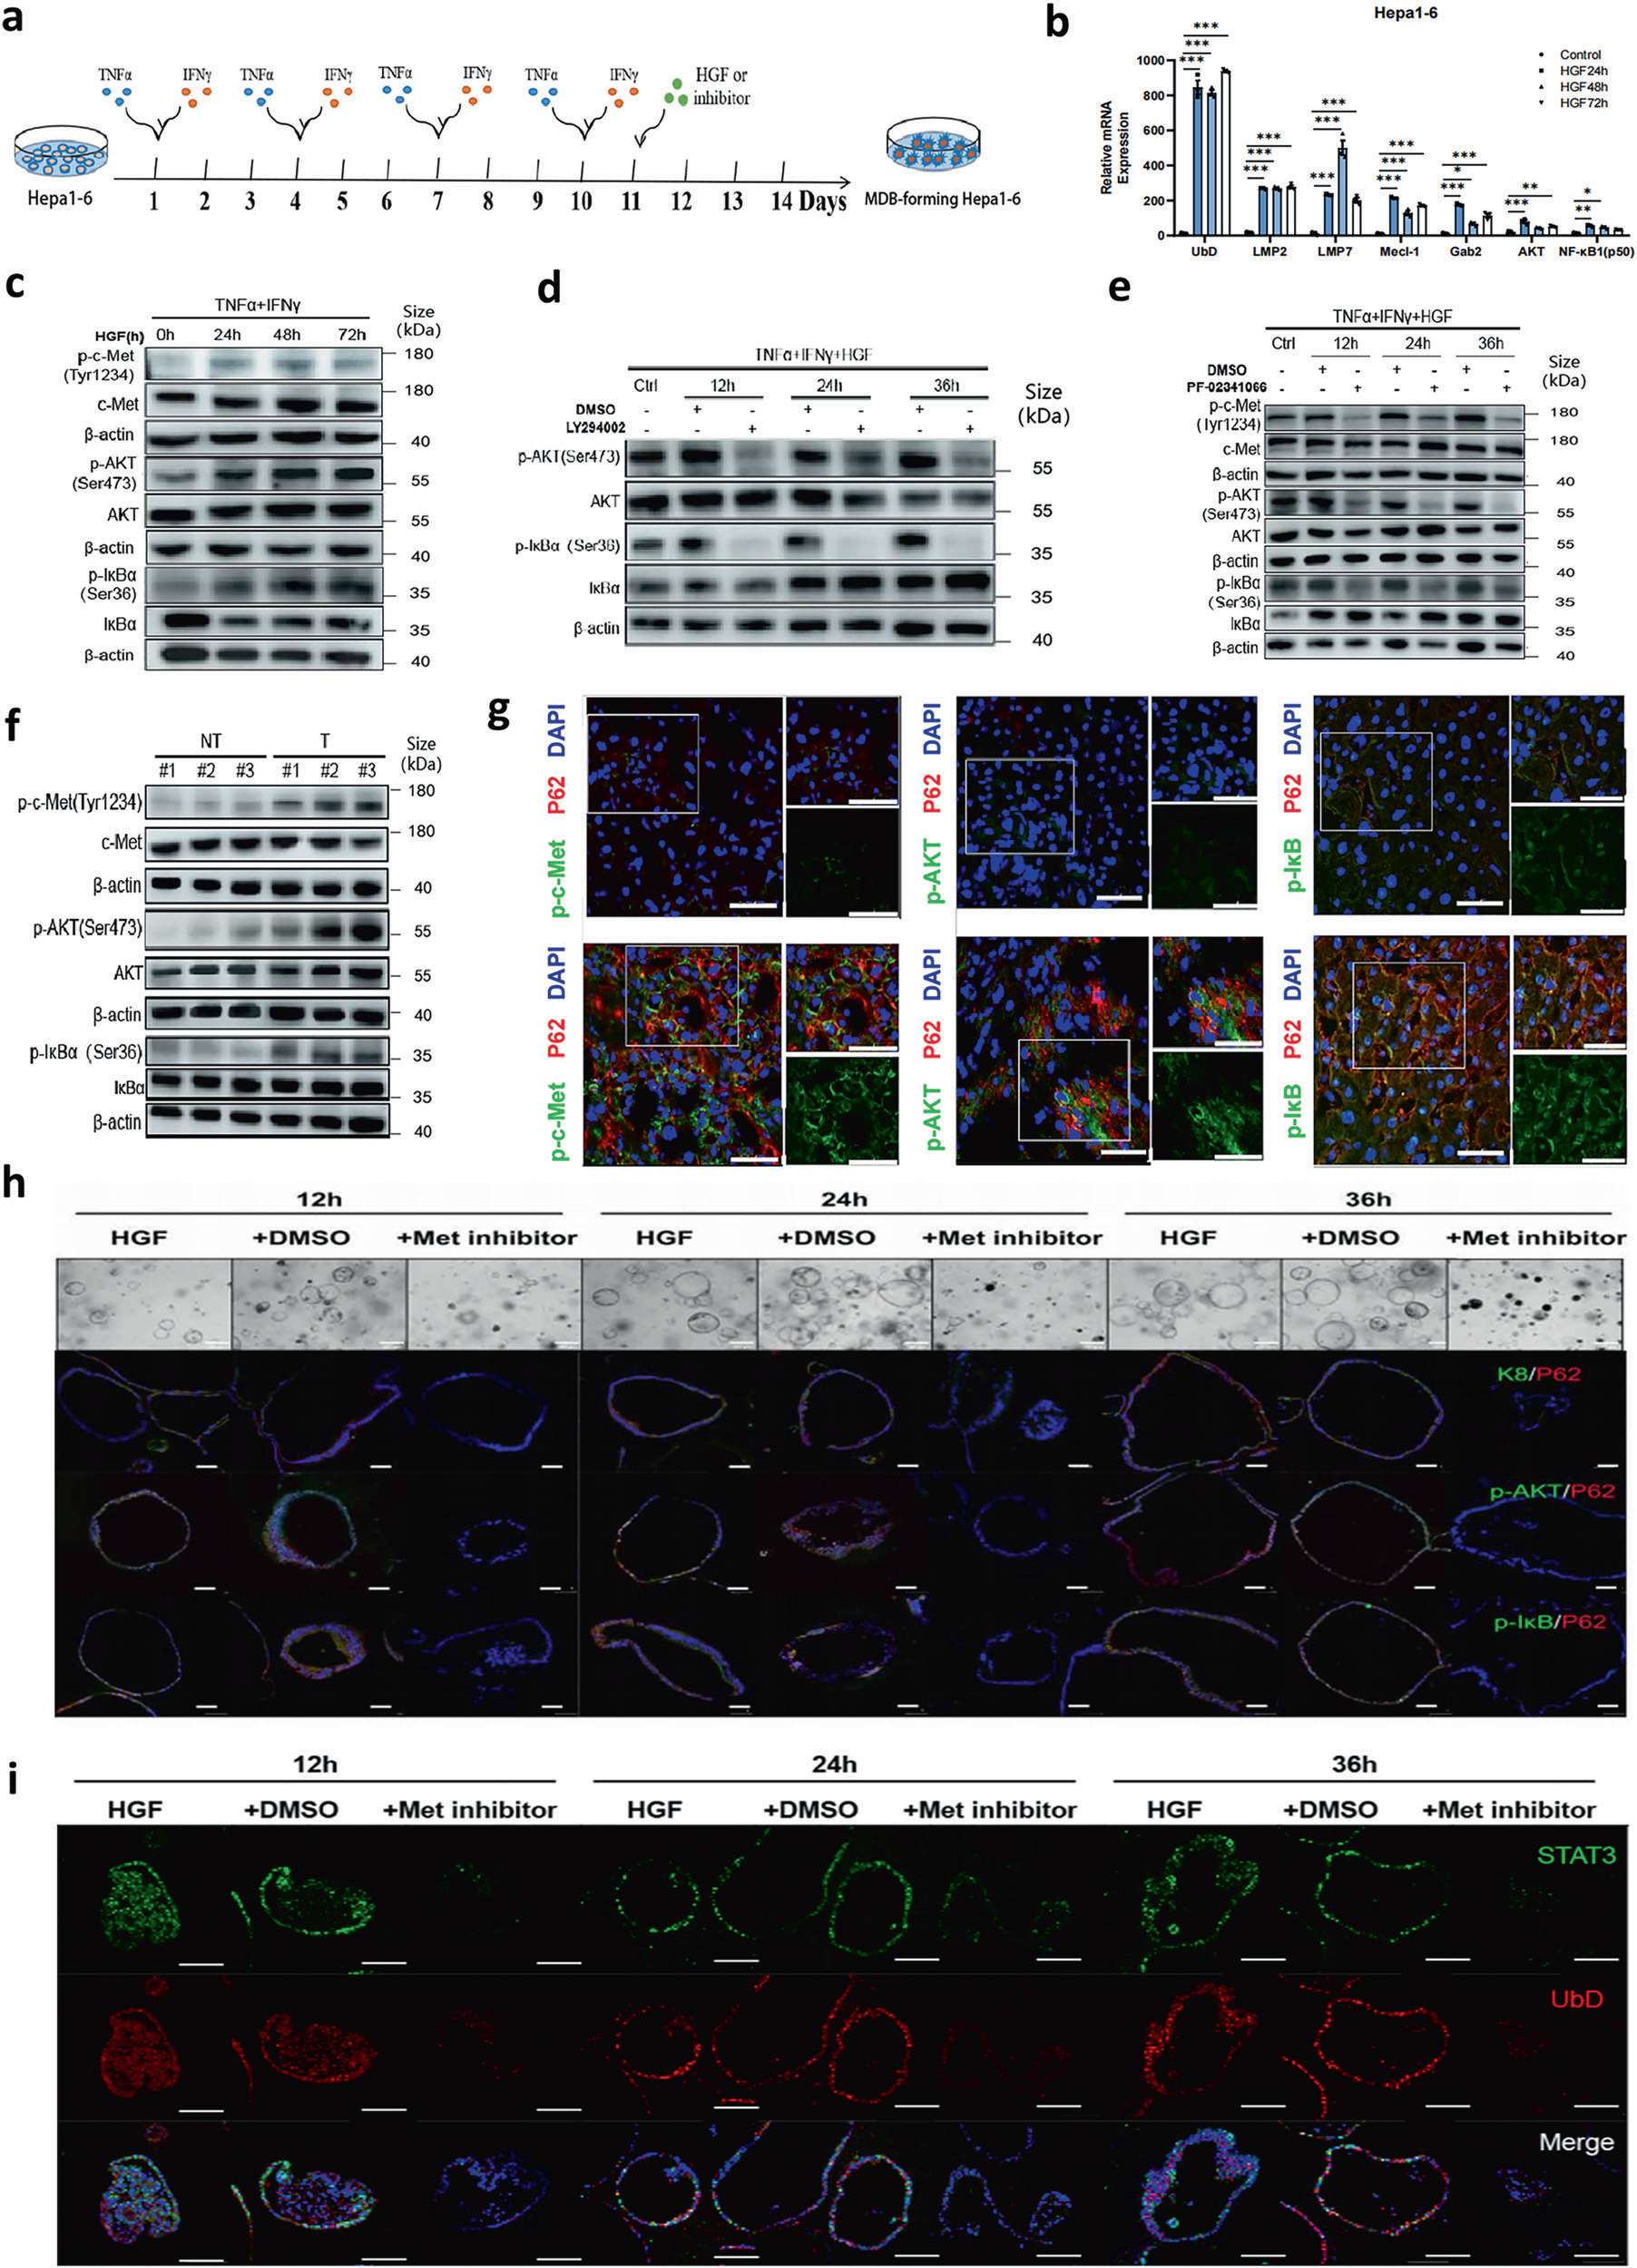 Fig. 6 The HGF/MET axis drives MDB formation via NF-κB and STAT3 signaling. a Experimental design schematic. Hepa1-6 cells were stimulated with TNFα (40 ng/mL) and IFNγ (400 ng/mL) at three-day intervals, and the cells were collected for assays. b mRNA expression in Hepa1-6 cells at 24, 48, and 72 h after HGF (20 ng/mL) treatment. c Western blot analysis of total and phosphorylated MET, AKT, and IκBα in MDB-forming Hepa1-6 cells after HGF treatment. d, e Western blot analysis of PI3K/AKT/NF-κB signaling in Hepa1-6 cells treated with HGF in the presence/absence of a PI3K inhibitor (LY294002) or MET inhibitor (PF-02341066). f Western blot analysis of signaling proteins in MDB-HCC tissues. g Immunofluorescence costaining of p-AKT, p-MET, and p-IκBα with p62 in MDB-HCC versus nontumor tissues (n = 5). Scale bar: 50 μm. h Bright-field and immunofluorescence imaging of MDOs treated with the MET inhibitor revealed that K8/p-AKT/p-IκBα colocalized with p62. Scale bars: 200 μm (bright field) and 50 μm (fluorescence). i Immunofluorescence imaging of STAT3 and UbD colocalization in MDOs treated with MET inhibitors. Scale bars: 100 μm (fluorescence). The data are shown as the means ± SEMs (n = 3 or 5). *p < 0.05; **p < 0.01; ***p < 0.001
模块 6:UbD 敲除(UbD?/?)小鼠体内反向验证通路功能
1.研究逻辑:CRISPR 构建 UbD 全身敲除小鼠,DDC 单 / 联合 CCl?诱导纤维化,对比野生型明确 UbD 缺失对 HGF/MET、炎症、纤维化、MDB 的抑制作用。
2.核心实验:UbD?/?小鼠鉴定;WB/qPCR 检测通路、MDB、纤维化基因;HGF/TNFα ELISA;组织免疫荧光 Vimentin/Desmin;多组病理染色量化纤维化、脂变、MDB。
3.关键实验结果:
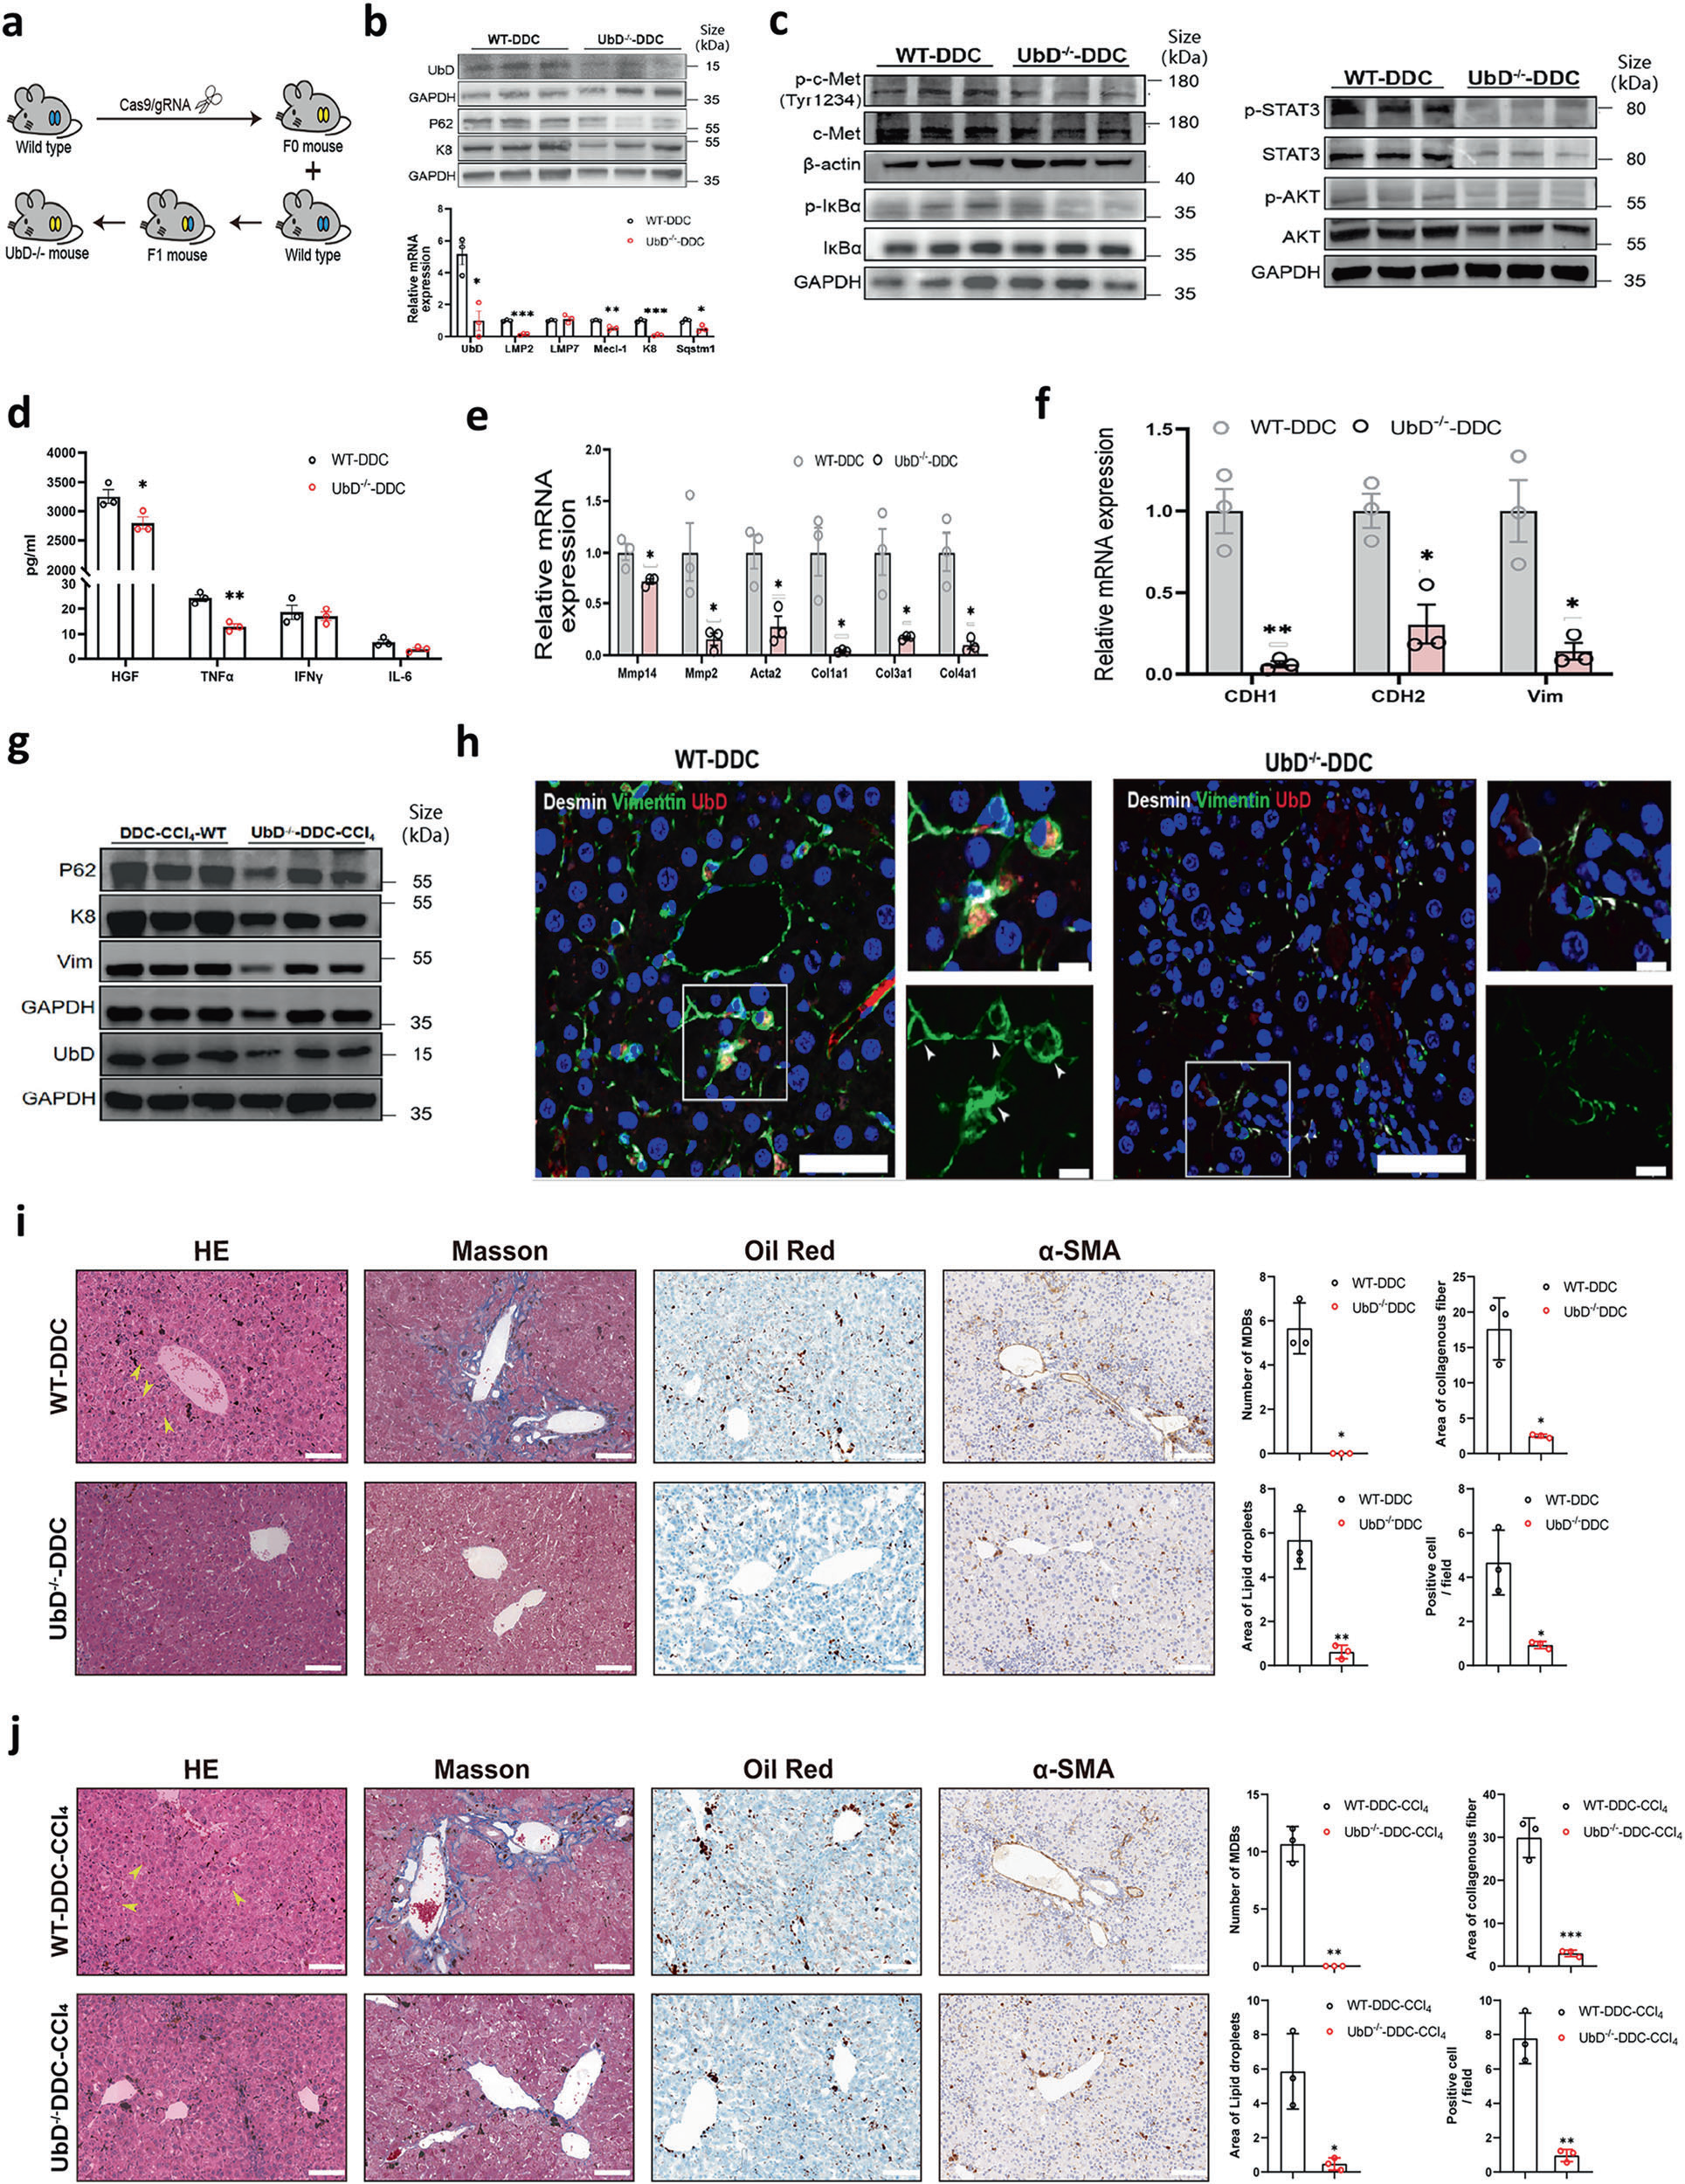 Fig. 7 UbD deletion suppresses MDB formation and fibrosis. a Schematic of the generation of UbD knockout (UbD?/?) mice via CRISPR/Cas9. b Western blot (top) and RT?qPCR (bottom) analyses of UbD, p62, K8, and proteasome-related genes in WT-DDC vs UbD?/?-DDC mice. c Western blot analysis of the HGF/MET/NF-κB and STAT3 pathways in WT vs UbD?/? mice. d ELISA analysis of HGF, TNFα, IFNγ, and IL-6 secretion in WT and UbD?/? mice after 8 weeks of DDC treatment (n = 3). e, f RT?qPCR of fibrosis markers (Mmp14, Mmp2, Acta2, Col1a1, Col3a1, and Col4a1) and EMT markers (Cdh1, Cdh2, and Vim) in WT and UbD?/? mice. g The expression of MDB and the fibrosis-related molecule vimentin was detected by Western blot in the UbD- / - -/DDC-CCl4 mice. h Immunofluorescence showing colocalization of Vimentin and UbD (white arrows) in the UbD?/? and WT mice. Scale bar: 50 μm; zoom: 10 μm. i H&E, Masson, Oil Red O and α-SMA immunostaining showing reduced MDB formation (yellow arrows), fibrosis, and lipid accumulation in the UbD?/?-DDC mice. Scale bar: 100 μm. j Histological analysis of liver sections from DDC-CCl?-induced fibrosis models (WT vs UbD?/?). Scale bar: 100 μm. The data are shown as the means ± SEMs (n = 3). *p < 0.05; **p < 0.01; ***p < 0.001
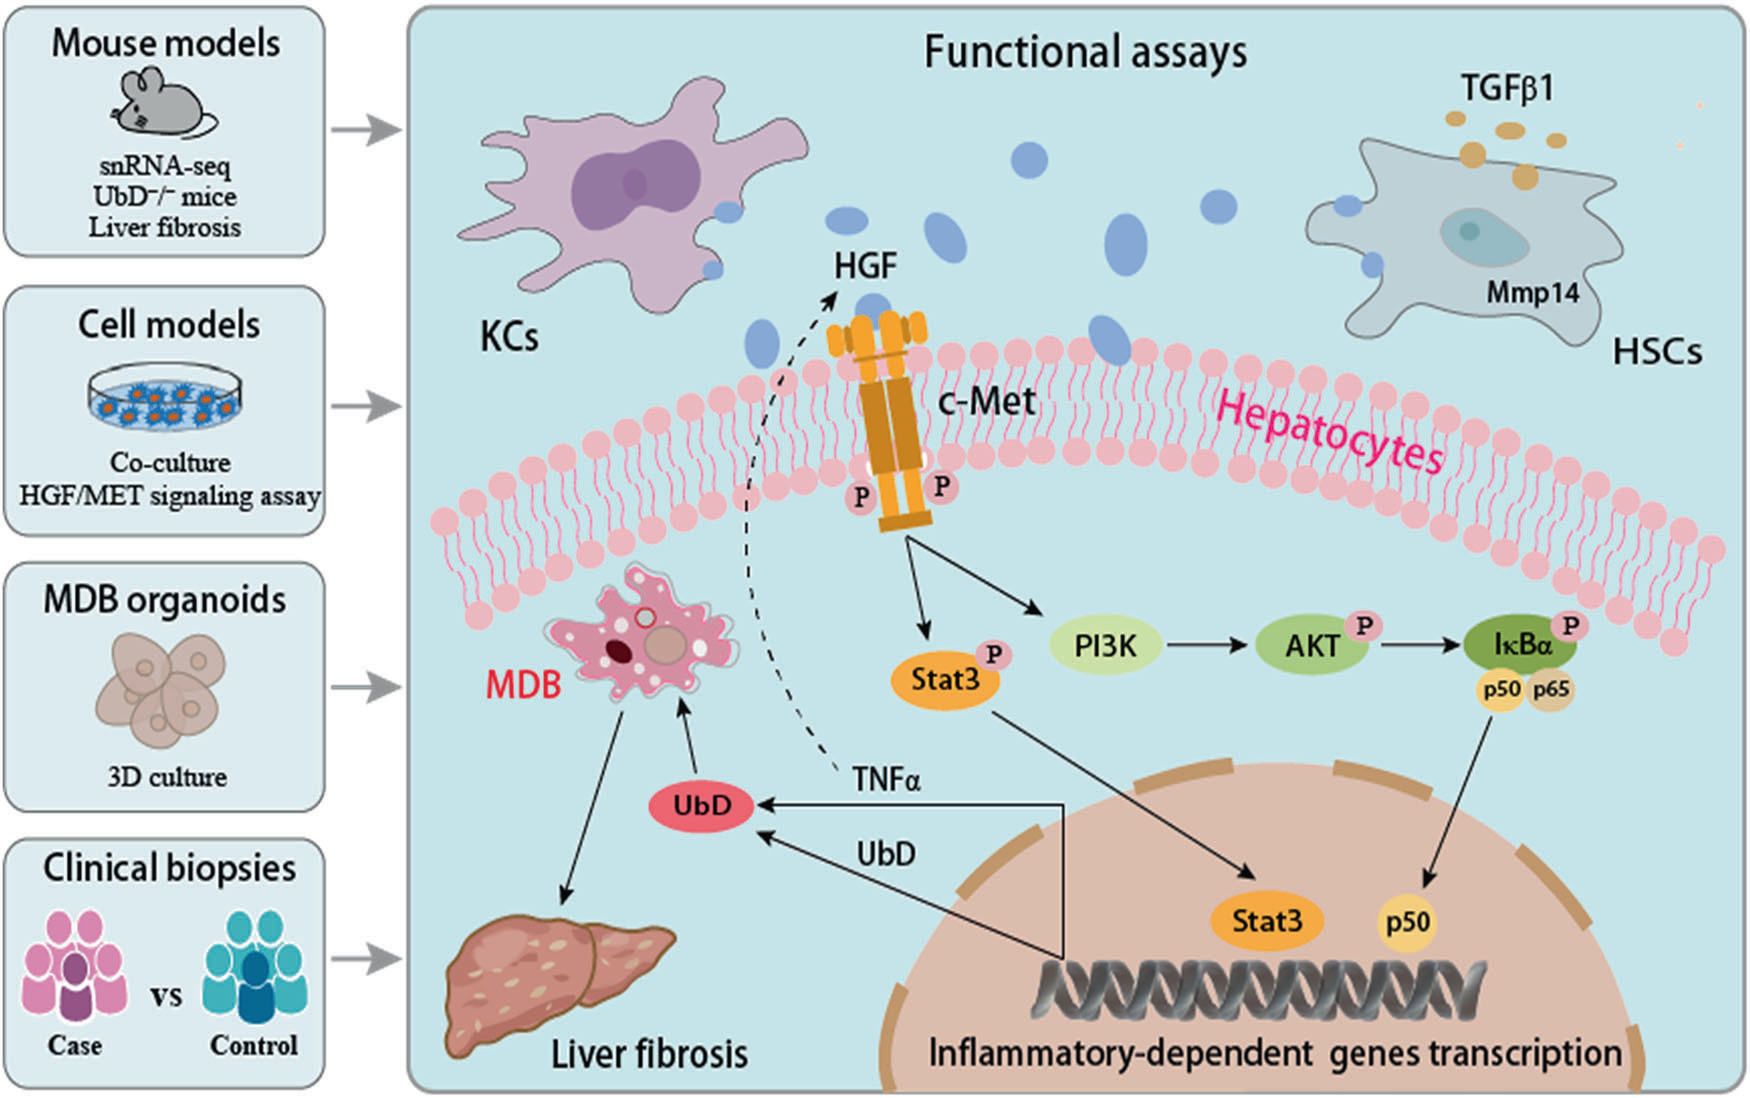 Fig. 8 Schematic diagram of the study. Functional in vitro and in vivo experiments demonstrated that, upon injury, HGF interacts with c-Met, activating the PI3K/AKT/NF-κB and STAT3 pathways and promoting UbD upregulation and the release of the proinflammatory cytokine TNFα, which leads to MDB pathogenesis and fibrosis development
五、Absin(abs9516 小鼠肝脏类器官培养试剂盒)产品整体作用总结

- 手机:13761418683