




- 手机:13761418683
联系人:爱必信
网址:http://www.absin.cn/
地 址:上海市浦东新区新浩路58号18号楼

- 提高交联度实现抗溶胀,但材料变硬,丧失组织匹配柔性;
- 引入疏水组分,需要大量表面活性剂、溶剂置换,存在细胞毒性风险;
- 导电水凝胶很难兼顾高湿态电导率 + 高拉伸性能,湿态导电普遍低于 1000 S/cm,拉伸不足 300%,难以用于植入器件。
- 开发无溶剂、无额外表面活性剂的胶束自组装新策略,合成柔软、高拉伸的抗溶胀水凝胶,作为器件封装基材;
- 构建微凝胶策略,开发可打印双相导电水凝胶墨水,搭配嵌入式 3D 打印(EM3DP)+ 两步固化工艺,精准调控单体扩散,突破湿态导电与拉伸的权衡瓶颈;
- 动物层面重点评估水凝胶植入后的异物反应、纤维化、多种蛋白空间表达,证明材料低免疫原性;
- 打印脑机接口 BCI、无线光电器件、坐骨神经刺激器三类原型器件,在大鼠体内完成长期植入功能验证。
- 溶胀因子低至~9.8%,相比传统水凝胶下降几十倍;
- 水相平衡后,拉伸应变最高可达 3500%,保持软组织相匹配模量;
- 该策略具备普适性,可拓展到 HEMA、MEA?HEA、AA?AM?EA 多套单体体系。
- 平衡水环境下电导率最高可达4000 S·cm?1;
- 电学失效拉伸应变 > 1300%;
- 对比均质填料体系,双相隔离结构极大降低渗流阈值,抑制溶胀带来导电通路断裂。
- 柔软抗溶胀水凝胶植入 2 周、8 周后,纤维化厚度、炎症浸润显著更低,接近假手术组;
- RNA?seq 转录组显示:软抗溶胀水凝胶组上调胞外基质(ECM)降解通路,其他材料组大量激活胶原合成,促进纤维囊形成;
- 多重免疫荧光 mIHC 直接观察纤维化相关蛋白空间表达:CD201 + 成纤维祖细胞、α?SMA 肌成纤维细胞、波形蛋白 Vimentin、核心蛋白聚糖 DCN、I 型胶原 COL1A1。
- 全水凝胶脑机接口 BCI:植入大鼠大脑皮层,术后 5 周仍然稳定记录体感诱发电位 ECoG 信号;
- 无线供电多层水凝胶光电器件:近场无线耦合,拉伸 250% 仍正常工作,大鼠皮下植入 7 天稳定点亮 LED;
- 无线坐骨神经刺激器:包裹大鼠坐骨神经,植入 1 周仍然有效诱发下肢运动;组织学证明神经周围纤维化程度远低于商用 Ecoflex 材料。
- 基于酪胺信号放大(TSA)技术,实现同一张石蜡切片多靶标共染,无需担心一抗种属来源冲突;
- 信号放大,对组织中表达丰度中等 / 偏低的纤维化蛋白实现清晰荧光成像;
- 输出多色荧光图像(原文图 3f),后续软件对 CD201、α?SMA、Vimentin、DCN、COL1A1、DCN 做信号半定量统计(图 3g?k),直观量化不同植入材料诱发纤维化程度差异;
- 支撑本文章生物学核心证据:解释为什么抗溶胀水凝胶可以减轻体内异物反应、抑制纤维囊形成。
【高分文献解读|Nature Materials】|破解植入器件体内纤维化难题!抗溶胀 3D 打印水凝胶生物电子实现长期体内植入|Absin 试剂助力 mIHC 机制解析
2026-08-20
文献标题:3D?printed implantable bioelectronics enabled by anti?swelling and biphasic conductive hydrogels
发表期刊:nature materials (IF=38)
DOI:https://doi.org/10.1038/s41563-026-02691-7
使用 Absin 产品:
| 货号 | 名称 |
| abs50038 | 七色多重荧光免疫组化染色试剂盒(plus)(抗兔二抗) |
| abs171412 | Rabbit anti?Vimentin Monoclonal Antibody(029?20) |
| abs115690 | Rabbit anti?DCN Polyclonal Antibody |
| abs131984 | Rabbit anti?Collagen I Polyclonal Antibody |
| abs47047616 | DAPI染色液 |

??研究背景与研究思路
植入式柔性生物电子器件是神经调控、脑机接口、外周神经刺激的核心硬件。传统硅基、弹性体器件刚性大,植入后极易诱发强烈异物反应(FBR),产生纤维囊包裹,造成器件信号衰减、功能失效。
水凝胶具备高含水、组织匹配力学、优异生物相容性,是下一代生物电子的理想材料。但传统水凝胶生理环境极易溶胀:溶胀会破坏封装结构、扯断导电通路,导致器件短时间内电学失效;同时过度溶胀挤压周围组织,进一步加重体内炎症与纤维化。
现有抗溶胀水凝胶方案普遍存在痛点:
??本论文核心研究思路:
?核心研究成果
1、胶束自组装抗溶胀水凝胶(封装基材)
利用亲水单体 HEA 与疏水单体 EA 自发形成胶束前驱体,UV 原位聚合得到纳米相分离 PHEA?PEA 水凝胶,疏水畴充当物理交联点,不需要外加交联剂。
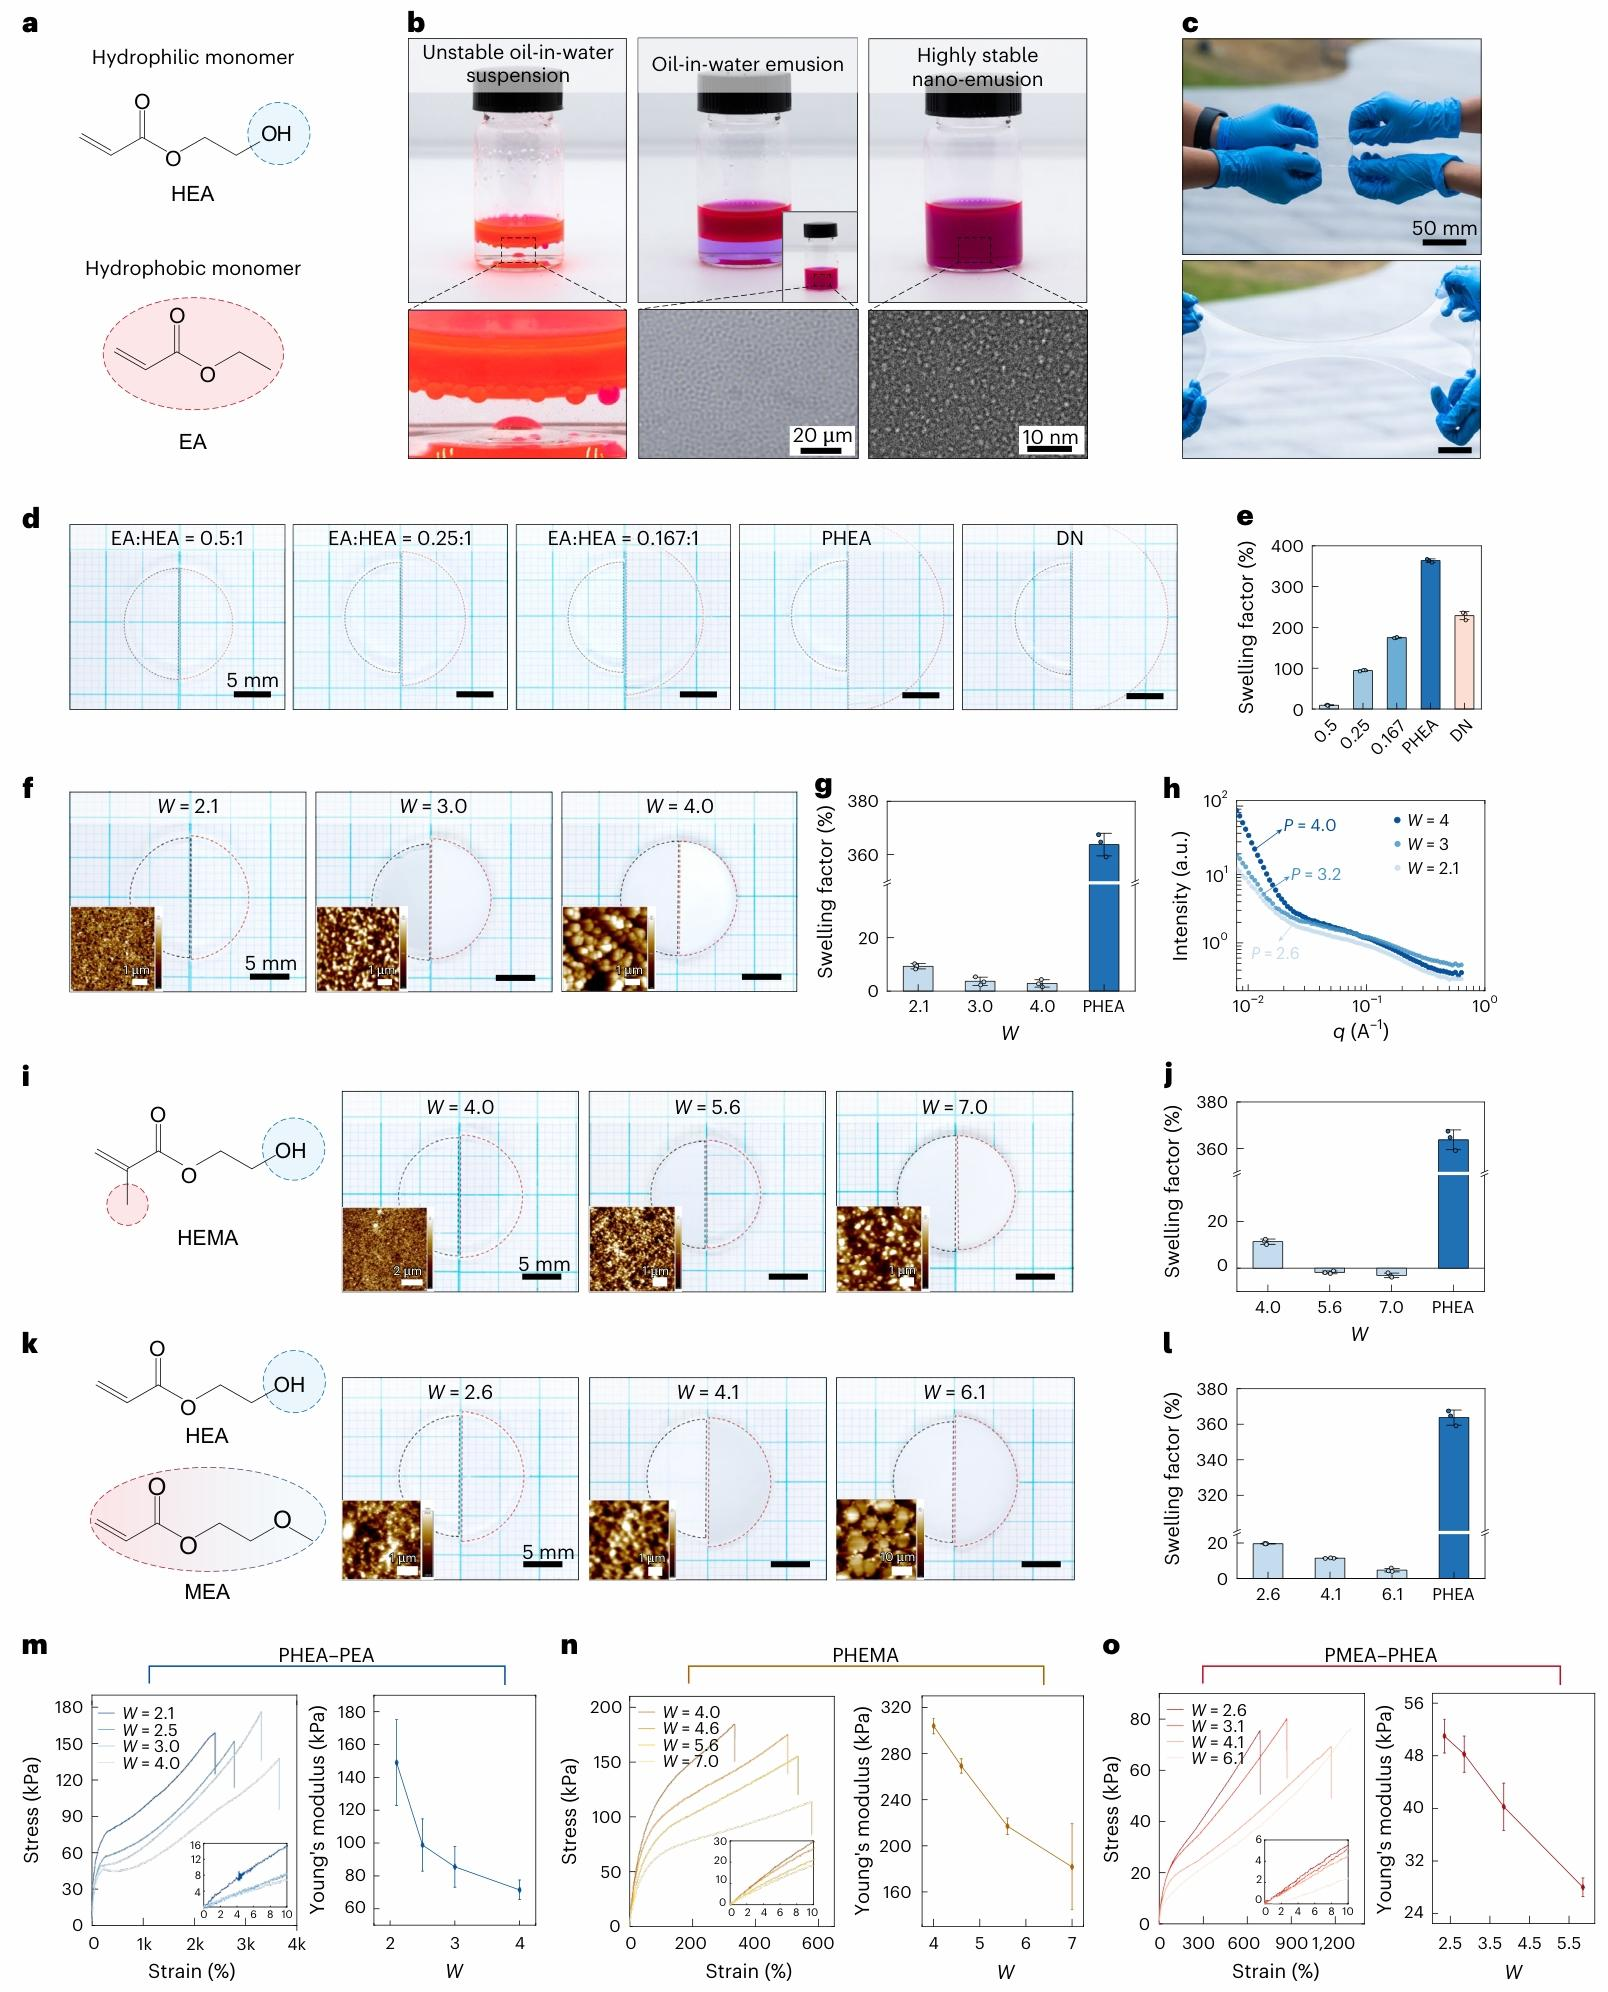 Fig. 2 | Design of anti?swelling hydrogels and their mechanical properties.
a, Molecular structures of hydrogel?forming hydrophilic monomer HEA and hydrophobic monomer EA. b, Gradually incorporating the hydrophilic monomer HEA into the EA–water mixture facilitates the transformation of an oil?in?water suspension into a homogeneous micelle monomer precursor. Insets: optical microscopic image of oil?in?water emulsion and cryo?electron microscopic image of nano?emulsion. Morphological investigations were performed on independent samples (n=3) and repeated at least five times. c, The UV?cured and swollen PHEA–PEA hydrogel demonstrates its extremely high stretchability. d,The swelling behaviours of PHEA–PEA hydrogels with different EA?to?HEA molar ratios, a pure PHEA hydrogel and an alginate–PAM double?network hydrogel (DN) (left depicts the original condition, right illustrates the equilibrated state). Scale bar, 5 mm. e, The swelling factors of PHEA–PEA hydrogels with different EA?to?HEA molar ratios, a pure PHEA hydrogel and a PAM–alginate double?network hydrogel. f, The swelling behaviours of PHEA–PEA hydrogels synthesized with varying water?to?monomer molar ratios (W=2.1, W=3.0 and W=4.0) (left depicts the original condition, right illustrates the swollen state, and the inset presents the atomic force microscope image of its swollen state showing its phase?separated microstructures). Scale bar, 5 mm. g, The swelling factors of PHEA–PEA hydrogels synthesized with varying water?to?monomer molar ratios. h, The SANS profiles of PHEA–PEA hydrogels with different W values. a.u., arbitrary units. The scattering vector is defined as q = (4π/λ)sin(θ/2). i, The anti?swelling hydrogels synthesized by direct curing of an amphiphilic HEMA monomer. Scale bar, 5 mm. j, The swelling factors of PHEMA anti?swelling hydrogels with varying water?to?monomer molar ratios. k, The anti?swelling hydrogels prepared by a combination of an amphiphilic monomer, MEA, and a hydrophilic monomer, HEA. Scale bar, 5 mm. l, The swelling factors of PMEA–PHEA anti?swelling hydrogels with varying water?to?monomer molar ratios. m, The stress–strain curves and Young’s modulus of PHEA–PEA anti?swelling hydrogels with different water?to?monomer molar ratios. n, The stress–strain curves and Young’s modulus of PHEMA anti?swelling hydrogels with different water?to?monomer molar ratios. o, The stress–strain curves and Young’s modulus of PMEA–PHEA anti?swelling hydrogels with different water?to?monomer molar ratios. The experiment in e,g,j,l,m,n,o was repeated independently (n=3). In e,g,j,l,m,n,o the values represent the mean±s.d.
2、双相导电水凝胶墨水,两步固化实现超高湿态导电
将抗溶胀水凝胶粉碎为微凝胶,复溶胀得到可打印支撑基质;混入银片得到双相导电墨水; 创新两步固化工艺:先快速 UV 固化限制单体过度扩散,再热固化完成聚合。规避一步固化时单体过度扩散稀释导电相的缺陷。
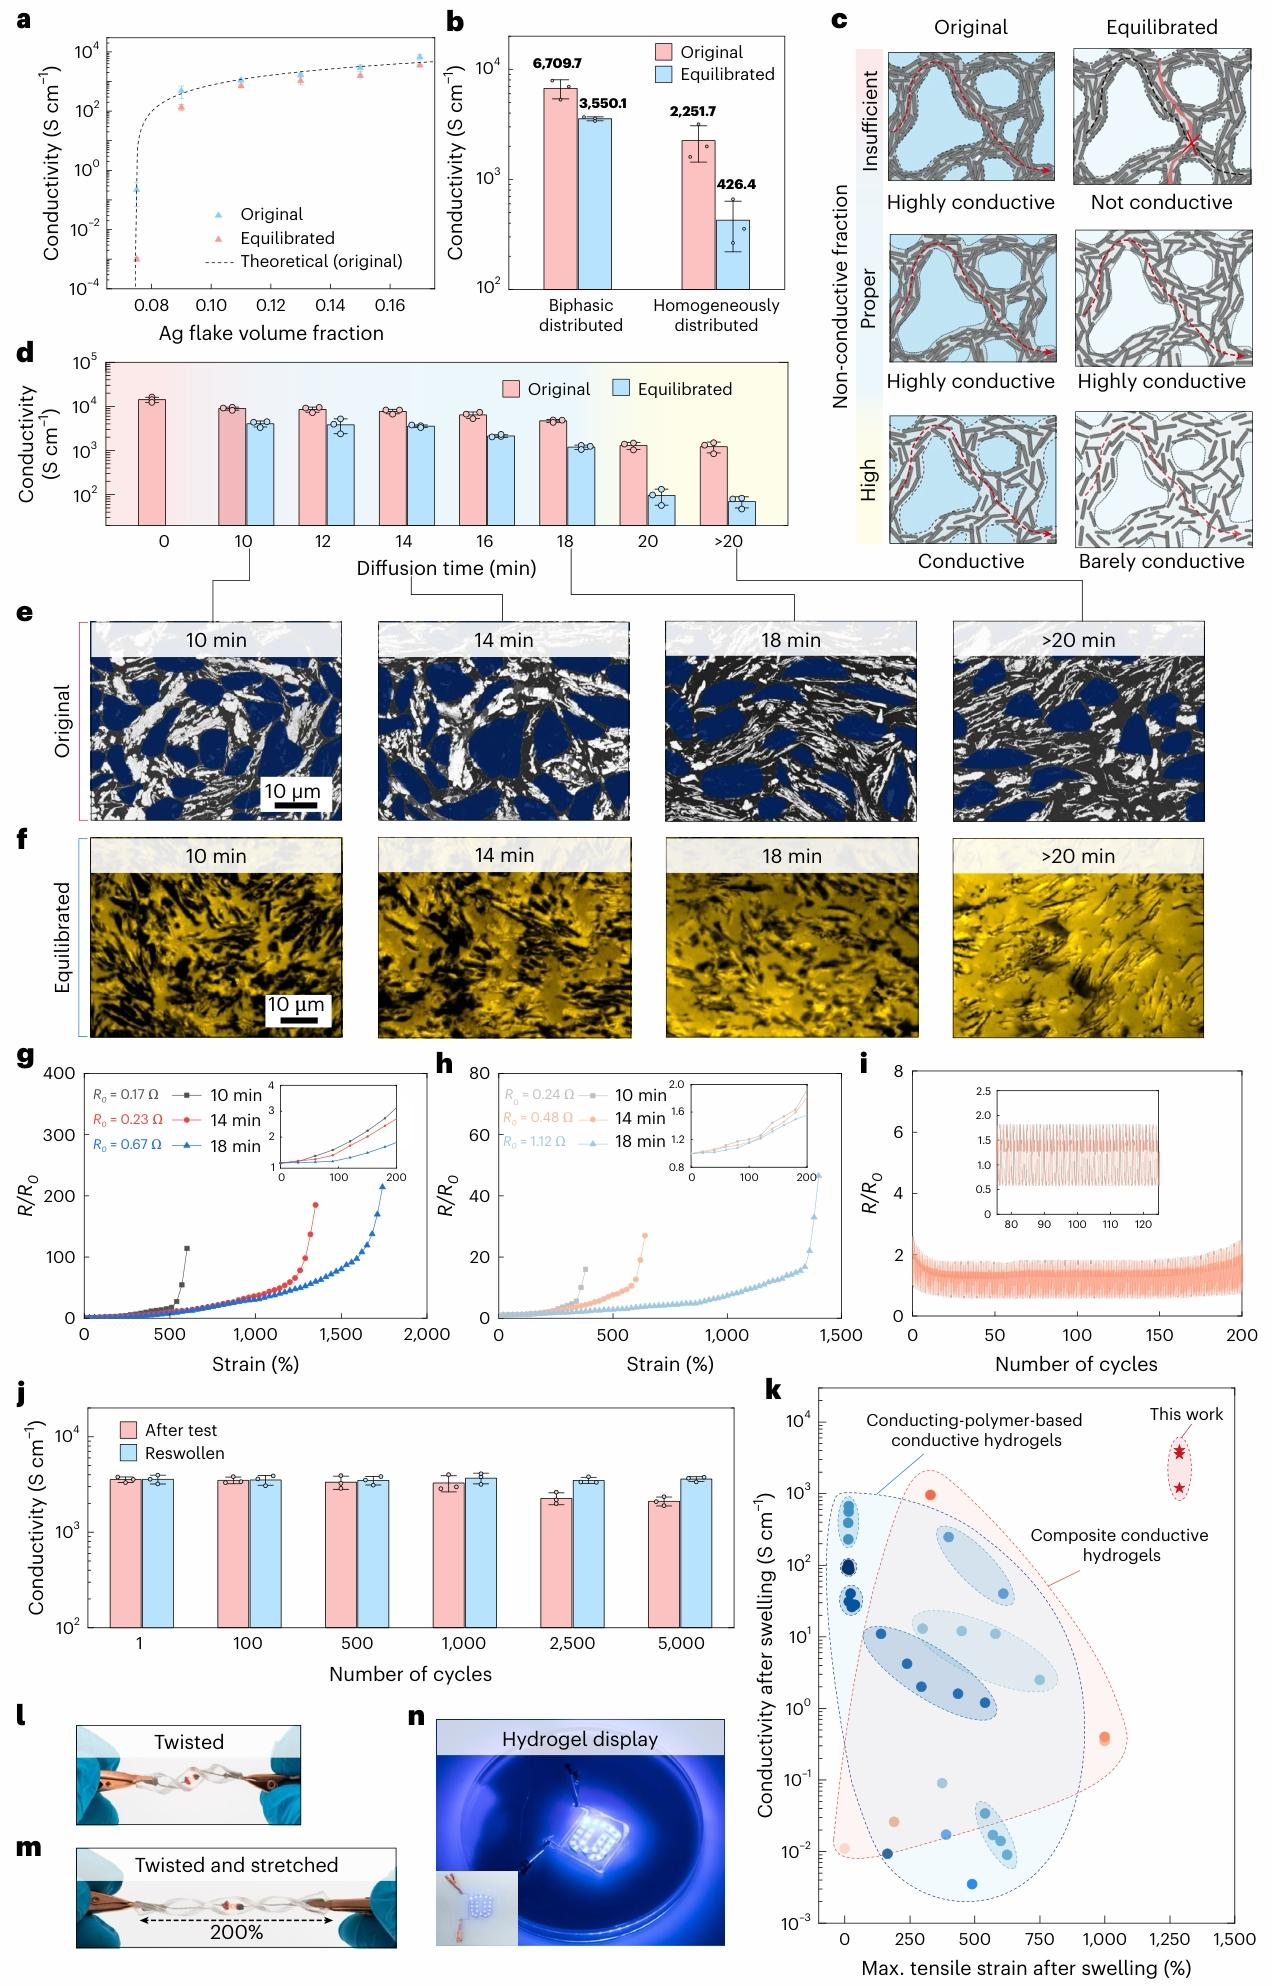 Fig. 4 | Electrical performance and electromechanical properties of the biphasic conductive anti?swelling hydrogels. a, A comparison of electrical conductivity of conductive hydrogel ink with varying Ag flake volume ratios (7.5%, 9%, 11%, 13%, 15% and 17%) in their original and swollen states; the dashed line indicates the theoretical conductivity before swelling, which is calculated by using a percolation threshold. b, A comparison of the electrical conductivity of conductive hydrogel with a biphasic distribution and homogeneous distribution of Ag flakes in their original and swollen states. c, Schematic illustration of the relationship between the hydrogel content in the conductive phase and its conductivity. d, Electrical conductivity as a function of diffusion time of printed conductive anti?swelling hydrogel in both its original and swollen states. e,f, Scanning electron microscopic and confocal microscopic images of conductive anti?swelling hydrogels with different diffusion times in original (e) and swollen (f) states. g, The normalized resistance (R/R0) of thin?film hydrogel resistors in their original state. h, The normalized resistance (R/R0) of thin?film hydrogel resistors in their swollen state. i, R/R0 of the printed resistor sample under cyclic stretching (strain, 200%). j, The conductivity evolution of the printed resistor under a cyclic stretching test and the conductivity after reswelling to balance. k, Ashby plot highlighting the combination of extremely high electrical conductivity and stretchability of our conductive hydrogel in its swollen state. References for the literature are listed in the Supplementary Information. l,m,A swollen μLED integrated hydrogel resistor that functioned stably on twisting (l) and stretching (m). n, A printed hydrogel display consisting of 23 μLEDs worked stably after being swollen in an aqueous environment for a month. The experiment in a,b,d,j was repeated independently (n=3). In a,b,d,j, the values represent the mean±s.d.
3、体内证实软抗溶胀水凝胶显著减轻异物反应 FBR
将不同材料皮下植入小鼠,对比硅胶 Ecoflex、普通溶胀水凝胶:
结果:抗溶胀水凝胶植入后肌成纤维细胞、胶原沉积显著更少,解释其低纤维化的分子机制。
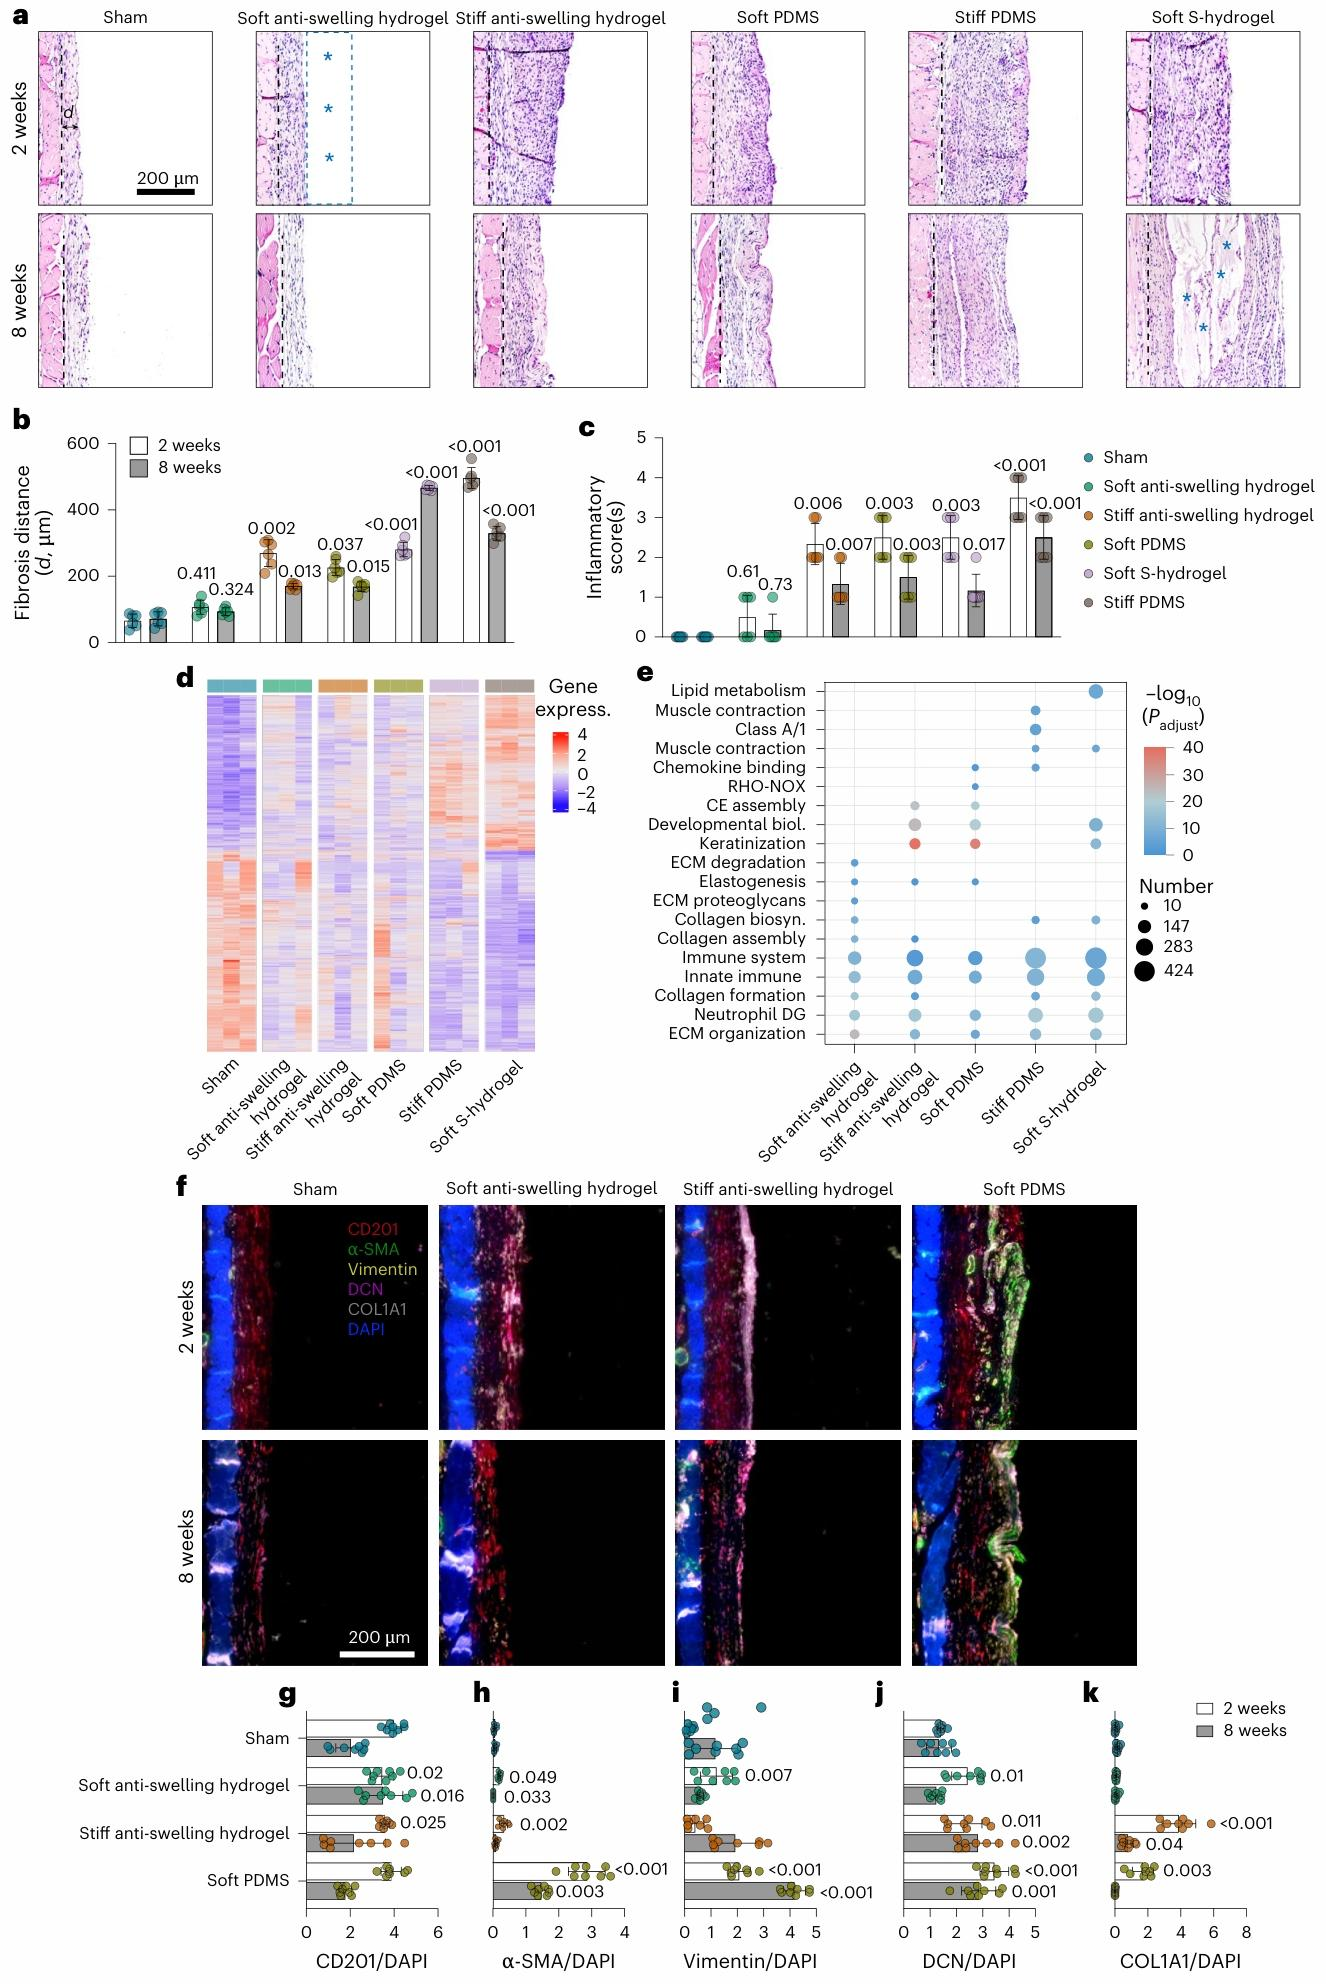 Fig. 3 | In vivo FBR of anti?swelling hydrogels. a, Skin tissues in contact with the implants were assessed for histopathology study using haematoxylin and eosin (H&E) staining. Representative images are shown. A black dashed line indicates the boundary between skin tissue and the fibrosis layer. d represents the fibrosis thickness. Asterisks indicate the implantation sites of the mock devices. b,c, Fibrosis thickness (b) and histological scores (c) for a were based on inflammatory cell infiltration and the fibrosis distance (n=6). Comparisons between the control group and implant groups were evaluated using the two?tailed Mann–Whitney U test; P?values are indicated in the figure. d, Heatmap of differential gene expression in mouse skin after 8 weeks implantation: the rows correspond to genes, the columns correspond to the groups and the colour gradient represents the relative levels of gene expression, with warmer colours indicating higher expression levels (n=3). e, Plot illustrating the results of reactome?based enrichment analysis conducted using the hypergeometric test, with P?values adjusted by the Benjamini–Hochberg method. Adjusted P<0.05 was set as the threshold for significant pathway enrichment. f, Mouse skin tissues harvested 2 weeks and 8 weeks after implantation were assessed for the multiplexed immunohistochemistry analysis (mIHC). The fibroblast is labelled with CD201/TSA 650, α?SMA/TSA 520, vimentin/TSA 570, DCN/TSA 660s and COL1A1/TSA 700 antibodies. DAPI, 4,6?diamidino?2?phenylindole. g–k, Quantification of each signal intensity from f: CD201/DAPI (g), α?SMA/DAPI (h), vimentin/DAPI (i), DCN/DAPI (j) and COL1A1/DAPI (k). n=8 mice, error bars indicate mean±s.e.m. Comparisons between the control group and implant groups were evaluated using the two?tailed Mann–Whitney U test; P?values are indicated in the figure.
4、3D 打印全套植入器件,大鼠体内长期功能验证
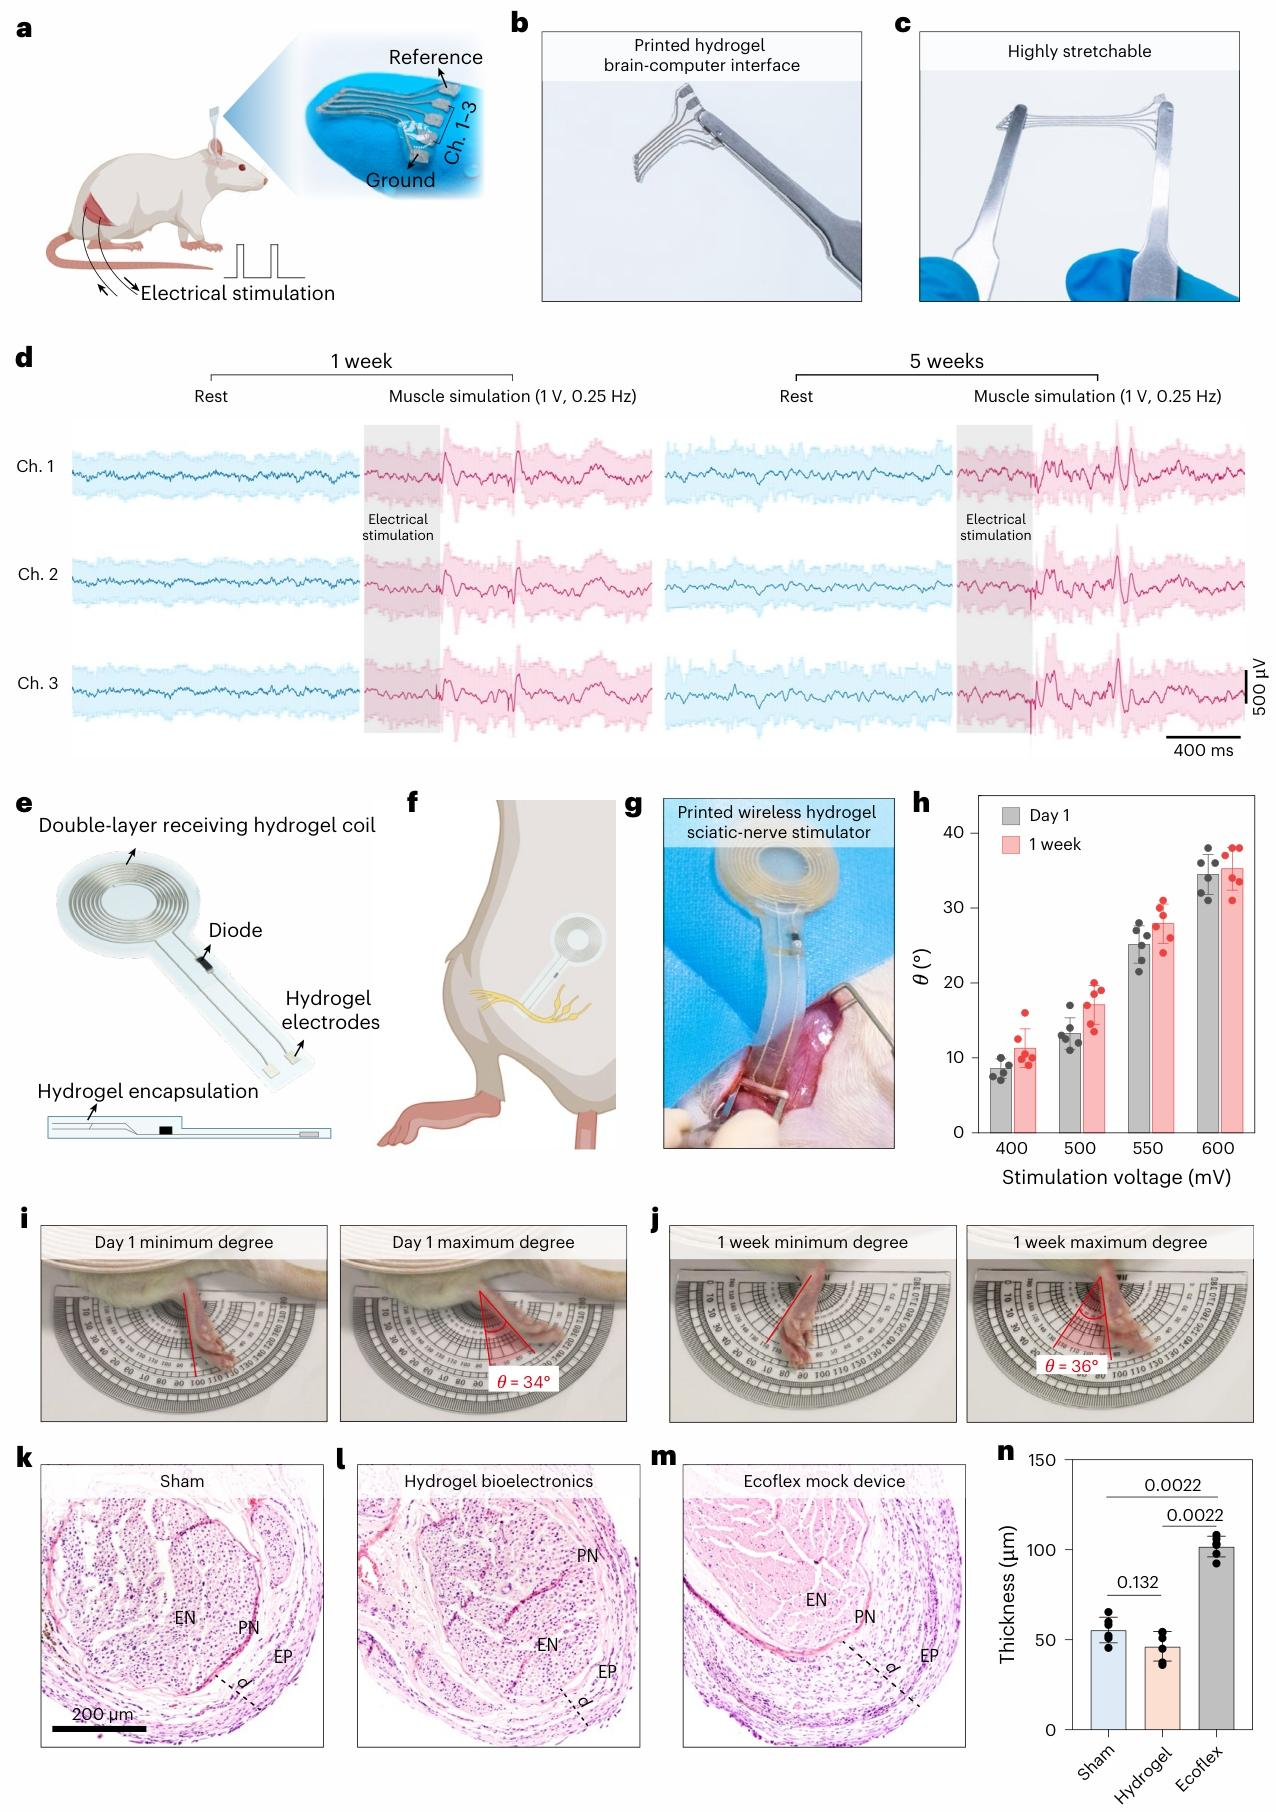 Fig. 6 | Long?term implantable anti?swelling?hydrogel?based bioelectronics. a, Schematic illustration of in vivo recording of somatosensory evoked potential via our printed all?hydrogel BCI. b,c, Digital images illustrating the configuration of the printed all?hydrogel BCI (b) and its high stretchability (c).d, Somatosensory evoked potential recorded 1 (left) and 5 weeks (right) after implantation. e,f, Schematic illustration of the configuration of the printed implantable wireless stimulator for rat sciatic nerves (e) and its implantation location (f). g, Digital image showcasing the printed wireless stimulator during implantation. h, Angle, θ, in response to output voltage generated by wirelessly powered hydrogel stimulator (400–600 mV, 1 Hz) on day 1 and after 1 week of implantation. Data are presented as mean values±s.d., with n=6 stimulations. i,j, Rat motion angle in response to wireless sciatic?nerve stimulation (600 mV, 1 Hz) on day 1 (i) and after 1 week (j) of implantation. k–m, Representative histologic images of rat sciatic nerves 1 week after implantation: sham operation group (k), wireless hydrogel stimulator group (l) and Ecoflex?30 mock?device group (m). ‘EN’, ‘PN’ and ‘EP’ represent endoneurium, perineurium and epineurium, respectively. The dashed line and d indicate the thickness of the epineurium. n, Thickness of epineurium for k–m, n=6 rats, error bars indicate mean±s.d., Mann–Whitney test, P?values are indicated in the figure. Illustrations created in BioRender: a, Hui, Y. https://biorender.com/f5rn6gg (2026); f, Hui, Y. https://biorender.com/fr07bkq (2026).
??Absin 产品在本研究中的应用
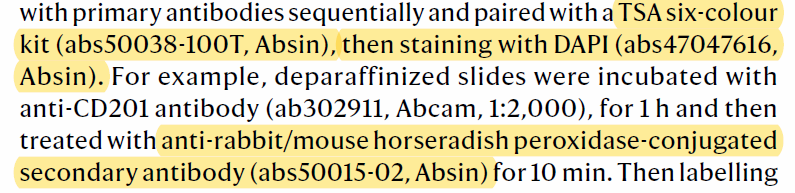
在多重免疫组化 mIHC这一关键生物学验证环节,该论文使用 Absin TSA 六色多重荧光免疫组化染色试剂盒 abs50038?100T,搭配 Absin 系列一抗、DAPI 复染试剂,实现单张石蜡切片上 5 个靶标蛋白同时成像,解析植入材料周边组织纤维化微环境。
1.abs50038 TSA 七色多重荧光免疫组化试剂盒
2.Absin 一抗(abs171412、abs115690、abs131984)
特异性识别纤维化、胞外基质关键蛋白 Vimentin、DCN、COL1A1,标记组织中成纤维细胞活化、胶原沉积水平,对比不同植入材料周围蛋白表达差异。
3.abs47047616 DAPI 复染试剂
细胞核标记,作为内参,用于归一化荧光信号强度,得到 Marker/DAPI 的相对荧光强度,用于统计学定量(图 3g?k 纵坐标)。
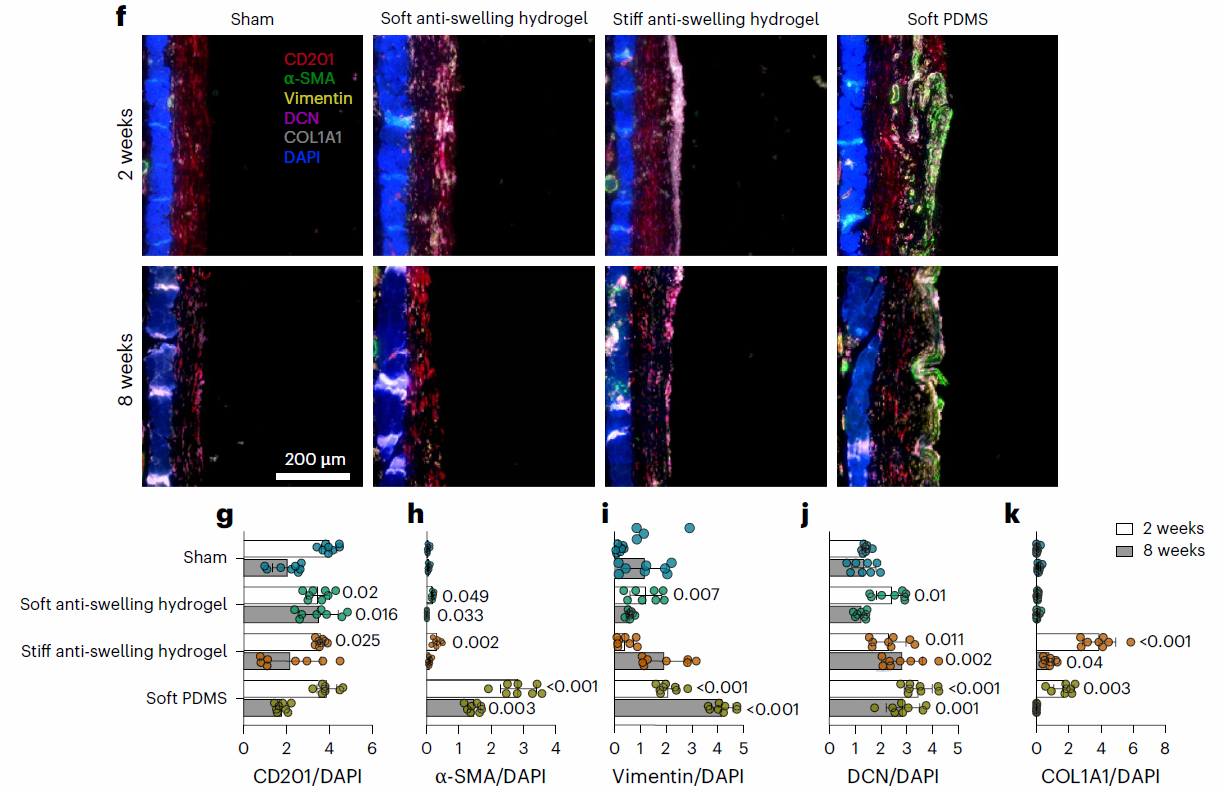 Fig. 3 | In vivo FBR of anti?swelling hydrogels. f, Mouse skin tissues harvested 2 weeks and 8 weeks after implantation were assessed for the multiplexed immunohistochemistry analysis (mIHC). The fibroblast is labelled with CD201/TSA 650, α?SMA/TSA 520, vimentin/TSA 570, DCN/TSA 660s and COL1A1/TSA 700 antibodies. DAPI, 4,6?diamidino?2?phenylindole.g–k, Quantification of each signal intensity from f: CD201/DAPI (g), α?SMA/DAPI (h), vimentin/DAPI (i), DCN/DAPI (j) and COL1A1/DAPI (k). n=8 mice, error bars indicate mean±s.e.m. Comparisons between the control group and implant groups were evaluated using the two?tailed Mann–Whitney U test; P?values are indicated in the figure.
在生物材料、植入器件的体内评估中,H&E 染色只能看形态,多重荧光 mIHC 才能解析细胞亚群、蛋白空间分布。 本研究利用 Absin TSA 多重荧光免疫组化平台,将材料宏观体内表现,推进到蛋白分子层面机制解释,是高分生物材料文章体内免疫微环境解析的经典范式。

- 手机:13761418683