




- 手机:13761418683
联系人:爱必信
网址:http://www.absin.cn/
地 址:上海市浦东新区新浩路58号18号楼

- PR 组上皮细胞与 T 细胞配体?受体互作几乎缺失,CR 组上皮? T 细胞通讯显著增强,免疫细胞浸润相关通路活跃;
- 上皮细胞再分群 + 拟时序显示最原始未分化干细胞(state1)绝大多数来源于 PR 患者,该亚群(cluster0/1/4/7)特异性高表达 CD80;
- 上皮内 CD80 与 ALDH1A1、SOX9、MET、MYC 干性基因显著正相关;TCGA 队列 CD80 与 CD44、BMI1、POU5F1 等 CSC 标志物表达正相关。
- HNSCC 肿瘤组织 CD80 蛋白显著高于正常口腔上皮细胞;HN6、CAL27 细胞 CD80 本底表达最高;
- ALDHhighCD44+、BMI1 + 干细胞亚群 CD80 mRNA 表达远高于非干细胞;悬浮肿瘤球细胞 CD80 显著高于贴壁肿瘤细胞;
- 流式分选 CD80 + 细胞体外形成肿瘤球数量显著多于 CD80 ? 细胞,证实 CD80 赋予肿瘤细胞自我更新干性。
- CD80 敲低显著下调 BMI1、ALDH1A1、CD44 干性基因,肿瘤球形成、细胞增殖、迁移侵袭能力同步下降;
- CD80 过表达上调干性标志物,肿瘤自我更新、增殖、侵袭能力显著增强,提示 CD80 直接驱动 HNSCC 恶性进展。
- CD80 敲低细胞干性、增殖、EMT 程序下调,分化、免疫相关基因显著上调;
- GSEA 显示 CD80 缺失显著激活 Th1 免疫应答、IL?2/IL?6 分泌、I 型干扰素通路;抑制 T 细胞失活、CTLA?4 负向调控通路;
- CD80 过表达显著抑制 CD8+αβ T 细胞活化通路,IFNG 等关键促炎杀伤因子表达下调。
- 仅 T 细胞共培养组肿瘤细胞杀伤微弱;加入 CD80 阻断抗体后 PI 阳性死细胞、Caspase3 阳性凋亡细胞比例大幅升高;
- 流式定量证实 CD80 抗体可解除肿瘤细胞对 T 细胞的抑制,显著提升 T 细胞介导的肿瘤细胞凋亡。
- CD80 抗体治疗组肿瘤体积、重量显著低于 IgG 对照组,肿瘤生长被显著抑制;
- IHC 定量显示 CD80 阻断组肿瘤内 Caspase3 凋亡信号、CD8+T 细胞浸润、GZMB/Perforin/IFN?γ 杀伤分子表达均显著升高;体内证实 CD80 阻断同时诱导肿瘤凋亡、激活 CD8+T 细胞抗肿瘤免疫。
《CD80-Mediated T-Cell Suppression by Cancer Stem-like Cells in Head and Neck Squamous Cell Carcinoma》SCI 文献深度解析
2026-08-31
一、文献基础综述
(一)期刊与基础信息
期刊:Cells(MDPI 出版,2026 最新 IF=8.7,中科院生物学大类 2 区、细胞生物学 3 区,SCI 开放获取期刊)
DOI:10.3390/cells15030266 卷期:2026, 15, 266
论文标题:CD80?Mediated T?Cell Suppression by Cancer Stem?like Cells in Head and Neck Squamous Cell Carcinoma
(二)全文核心结论
头颈部鳞癌(HNSCC)新辅助放免治疗应答不佳患者(PR)肿瘤内富集高表达 CD80 的肿瘤干细胞(CSC);CD80 一方面增强 CSC 干性、促进肿瘤增殖侵袭,另一方面通过抑制 Th1 免疫通路、削弱 CD8+T 细胞杀伤能力介导免疫逃逸;体内外实验证实阻断 CD80 可同时抑制肿瘤恶性表型、重塑抗肿瘤免疫微环境,CD80 是改善 HNSCC 新辅助放免疗效的全新靶点。
(三)爱必信 Absin 产品应用简述
研究采用abs119676 兔抗 Caspase3 多克隆抗体,用于流式胞内染色、肿瘤组织免疫组化,定量检测肿瘤凋亡细胞比例,直观验证 CD80 阻断后 T 细胞介导的肿瘤凋亡提升;该抗体特异性识别活化凋亡标志物 Caspase3,为细胞共培养、动物体内药效凋亡指标检测提供可靠分子标记支撑。
二、研究领域背景介绍
头颈部鳞状细胞癌(HNSCC)恶性程度高,极易出现治疗抵抗、复发转移。PD?1 联合化疗的新辅助放免方案是局部晚期 HNSCC 主流根治前治疗手段,真实世界数据显示客观缓解率仅 66.7% 左右,大量患者仅达部分缓解(PR),存在残留肿瘤,器官保存率与远期生存受限,亟待阐明耐药机制、开发增敏靶点。
肿瘤干细胞(CSC)是驱动放化疗、免疫治疗抵抗的核心细胞亚群,具备自我更新、高侵袭、免疫逃逸特性,ALDHhighCD44+、BMI1 + 是 HNSCC 经典 CSC 标志物。现有研究证实 CSC 可通过多重通路抑制 T 细胞活化,但 CSC 调控免疫抑制的关键膜分子尚不明确;CD80 属于 B7 共刺激分子家族,常规认知为抗原提呈细胞活化 T 细胞的正性共刺激分子,但其在肿瘤干细胞上的独特免疫抑制功能缺乏完整体内外机制验证,且未关联 HNSCC 新辅助治疗耐药。
本研究以此为切入点,利用患者肿瘤单细胞核转录组(snRNA?seq)对比 PR、完全缓解(CR)患者细胞亚群差异,锁定 CSC 高表达 CD80 这一关键特征,完整解析 CD80 同时调控肿瘤干性与 T 细胞抑制的双重促癌机制,填补 HNSCC CSC 介导免疫耐药领域空白。
三、作者整体递进研究思路总结
全文遵循临床患者样本生信筛选→临床样本细胞亚群验证→体外细胞干性 / 恶性表型功能实验→肿瘤细胞? T 细胞共培养免疫功能验证→小鼠同基因荷瘤体内药效验证→转录组通路机制挖掘完整转化医学逻辑链:
1.4 例接受替雷利珠单抗 + 顺铂紫杉醇新辅助治疗 HNSCC 患者肿瘤样本 snRNA?seq,分 PR/CR 组,对比细胞互作、上皮干细胞亚群基因表达,发现 PR 患者原始 CSC 高富集 CD80;TCGA 公共数据集验证 CD80 与干性标志物正相关;
2.细胞流式分选 ALDHhighCD44+、BMI1+、CD80 + 亚群,qPCR、Western blot 验证 CD80 特异性高表达于 CSC;肿瘤球形成实验证明 CD80 + 细胞干性更强;
3.构建 CD80 敲低、过表达稳转细胞株,肿瘤球、CCK8 增殖、Transwell 迁移侵袭实验,明确 CD80 正向调控 HNSCC 干性与恶性侵袭表型;
4.CD80 敲低细胞 RNA?seq+GSEA 富集,证实 CD80 缺失激活 Th1、IL?2、I 型干扰素等促 T 细胞活化通路;CD80 过表达抑制 CD8+T 细胞活化通路;
5.体外肿瘤细胞与原代 CD3+T 细胞共培养,CD80 阻断抗体干预,Calcein AM/PI、Absin Caspase3 流式染色定量肿瘤细胞死亡率,验证 CD80 阻断增强 T 细胞细胞毒;
6.C57BL/6 小鼠 MOC1/MOC2 口腔鳞癌同基因移植模型,腹腔注射 CD80 中和抗体,监测肿瘤体积重量;肿瘤组织 IHC 使用 Absin Caspase3、CD8、GZMB、Perforin、IFN?γ 抗体,体内证实 CD80 阻断抑制肿瘤生长、提升 CD8+T 浸润与杀伤分子分泌;
7.机制讨论阐明 CD80 优先结合 T 细胞 CTLA?4 介导免疫抑制,同时调控 CSC 干性程序,提出靶向 CD80 联合新辅助放免的临床转化策略。
四、分模块详细研究思路、实验结果、对应原文图片
模块 1:snRNA?seq 解析 PR/CR 患者肿瘤微环境与 CSC CD80 特征
1.研究逻辑:对比新辅助治疗不同应答患者肿瘤细胞亚群、细胞通讯,定位耐药相关干细胞特征分子 CD80;轨迹分析明确原始干性细胞富集 CD80;公共数据库验证 CD80 与干性标志物相关性。
2.核心实验:FFPE 肿瘤样本单细胞核 RNA 测序、Seurat 分群注释、CellChat 细胞通讯分析、Monocle2 拟时序轨迹、TCGA 相关性分析;
3.关键实验结果:
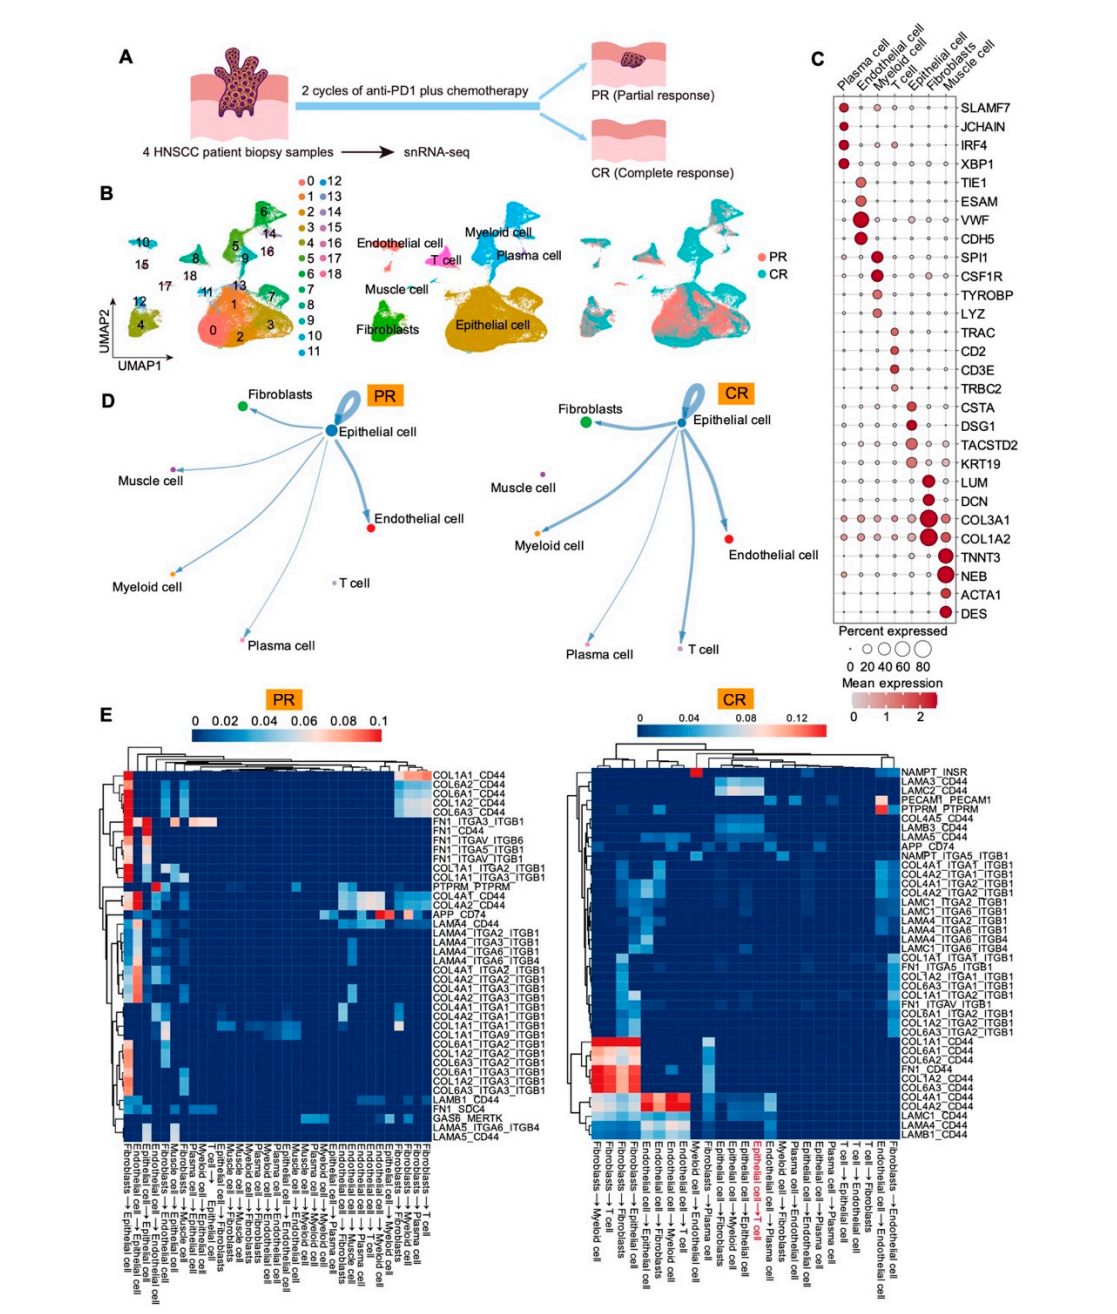 Figure 1. SnRNA?seq profiling of diverse cell types and cell–cell interactions in PR and CR patients. (A) Schematic diagrams summarize treatment regimens and group assignment (PR vs. CR) for the four patients profiled by snRNA?seq. (B) UMAP plots show the distribution of cell populations in four HNSCC patients, who are divided into PR and CR groups undergoing neoadjuvant therapy. PR, partial responders. CR, complete responders. N = 58,352. (C) The Dot plot shows seven cell types and the expression of the marker genes. (D) Cell–cell communication analysis reveals the interactions between epithelial cells and other populations in the PR and CR groups.
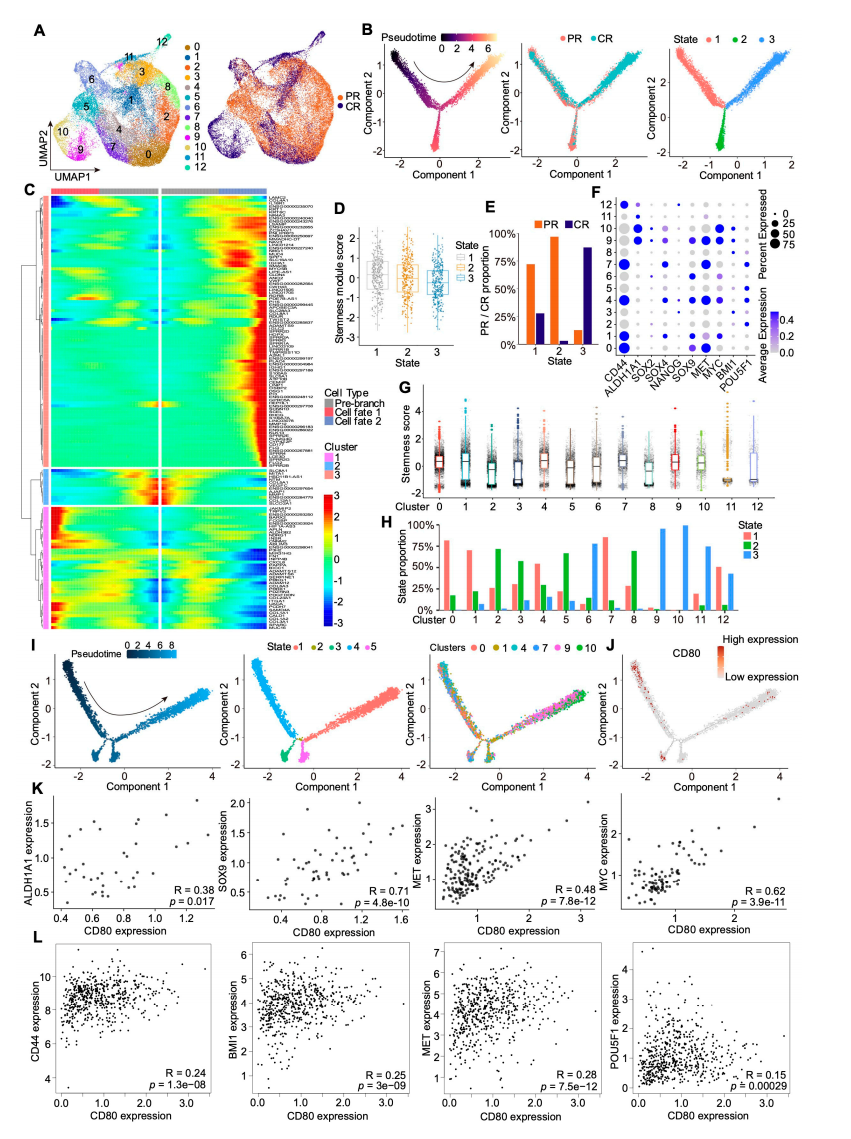 Figure 2. CD80 is related to cancer?cell stemness in PR and CR patients. (A) UMAP plots show re?clustering of epithelial cells in PR and CR groups. (B) Pseudotime analysis demonstrates the derivation of epithelial cells in PR and CR groups based on the derived trajectory, tissue origin, and monocle states. (C) The Heatmap shows the top genes expressed with the pseudotime trajectory of three fate cells. (D) The Boxplot shows the stemness scores of three state cells. (E) The PR and CR proportions in each state. (F) The Dot plot shows the expression levels of stemness?related genes in each cluster of epithelial. (G) The Boxplot shows stemness scores among different clusters of epithelial cells. (H) The state proportion in each cluster. (I) Pseudotime analysis shows the derivation of clusters 0, 1, 4, 7, 9, and 10 from epithelial cells based on monocle states and cluster origin. (J) Trajectory of the expression of CD80. (K) Analysis of the correlation between CD80 and stemness?related genes ALDH1A1, SOX9, MET, and MYC in epithelial cells from PR and CR groups. (L) Analysis of the correlation between CD80 and stemness?related genes CD44, BMI1, MET, and POU5F1 in HNSCC based on TCGA HNSCC datasets.
上胞拟时序与CD80干性关联
模块 2:细胞水平验证 CD80 特异性高表达于 CSC 亚群
1.研究逻辑:流式分选经典 CSC 亚群,检测 CD80 表达;分选 CD80+/CD80 ? 细胞对比成球能力,证明 CD80 标记功能性肿瘤干细胞。
2.核心实验:Western blot 组织蛋白、流式分选 ALDHhighCD44+/BMI1+/CD80 + 细胞、RT?qPCR、肿瘤球形成实验;
3.关键实验结果:
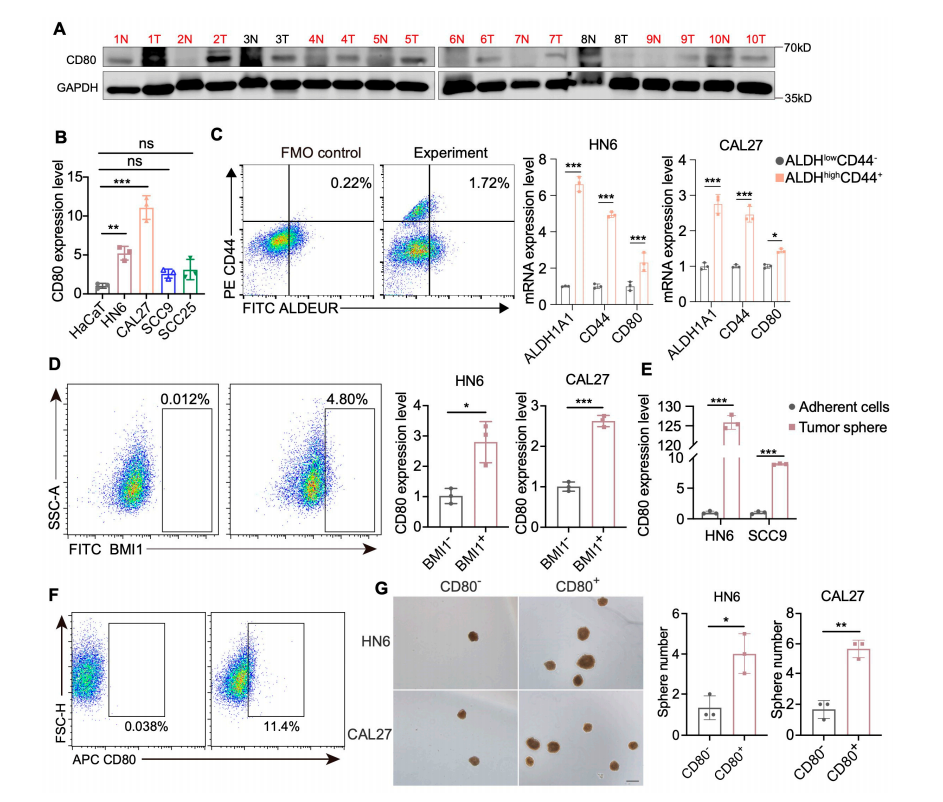 Figure 3. CD80 is highly expressed in CSCs. (A) Western blot shows protein expression levels of CD80 in 10 paired HNSCC tissues. (B) The expression level of CD80 in normal epithelial cell line (HaCaT) and HNSCC cell lines (HN6, CAL27, SCC9, and SCC25). Values are mean ± SD. ns, no significance; ** p < 0.01; *** p < 0.001; One?way ANOVA test; n = 3. (C) Flow cytometry isolates ALDHhighCD44+ populations from HNSCC cell lines. The left panel shows the fluorescence minus one (FMO) control (the ALDH?only control). And RT?qPCR shows significantly higher CD80 expression in ALDHhighCD44+ versus ALDHlowCD44? cancer cells. Values are mean ± SD. * p < 0.05; *** p < 0.001; Student’s t test, n = 3. (D) Flow cytometry isolates BMI1+ populations from HNSCC cell lines, and RT?qPCR shows significantly higher CD80 expression in BMI1+ versus BMI1? cancer cells. Values are mean ± SD. * p < 0.05; *** p < 0.001; Student’s t test, n = 3. (E) RT?qPCR shows significantly higher CD80 expression in tumor sphere versus adherent cells in HNSCC cells. Values are mean ± SD. *** p < 0.001; Student’s t test, n = 3. (F) Representative images of flow?cytometry show CD80+ HNSCC cells. (G) Representative images of tumor spheres and quantification of the sphere number of CD80? and CD80+ HNSCC cells. Scale bar, 200 μm. Values are mean ± SD. * p < 0.05; ** p < 0.01; Student’s t test, n = 3.
3.4. CD80 Regulates the Stemness of CSCs and Pro?Tumorigenicity in HNSCC
To investigate whether CD80 can regulate tumor cell stemness, we established CD80 knockdown and overexpression models. Silencing CD80 reduced the expression of stemness?related marker genes and markedly attenuated tumorsphere formation (Figure 4A,B). In contrast, CD80 overexpression reprogrammed stemness?related transcriptional programs, leading to upregulation of stemness markers, enhanced self?renewal capacity, and increased sphere formation (Figure 4C,D). We next examined the impact of CD80 on malignant behavior. Upregulation of CD80 increased the migration and invasion of HNSCC cells, consistent with a more aggressive phenotype and potential promotion of tumor progression (Figure 4E). Conversely, CD80 downregulation weakened tumor cell proliferation and concomitantly reduced their migratory and invasive abilities (Figure 4F,G). Together, these data show that CD80 regulates both stemness and malignant properties o
3 CSC亚群高表达CD80
模块 3:CD80 调控 HNSCC 干性、增殖、迁移侵袭恶性表型
1.研究逻辑:双向调控 CD80(siRNA 敲低 / 质粒过表达),多表型实验明确 CD80 促癌功能。
2.核心实验:CD80 siRNA 干扰、CD80 过表达质粒转染、RT?qPCR 干性基因检测、肿瘤球、CCK8 增殖、Transwell 迁移侵袭;
3.关键实验结果:
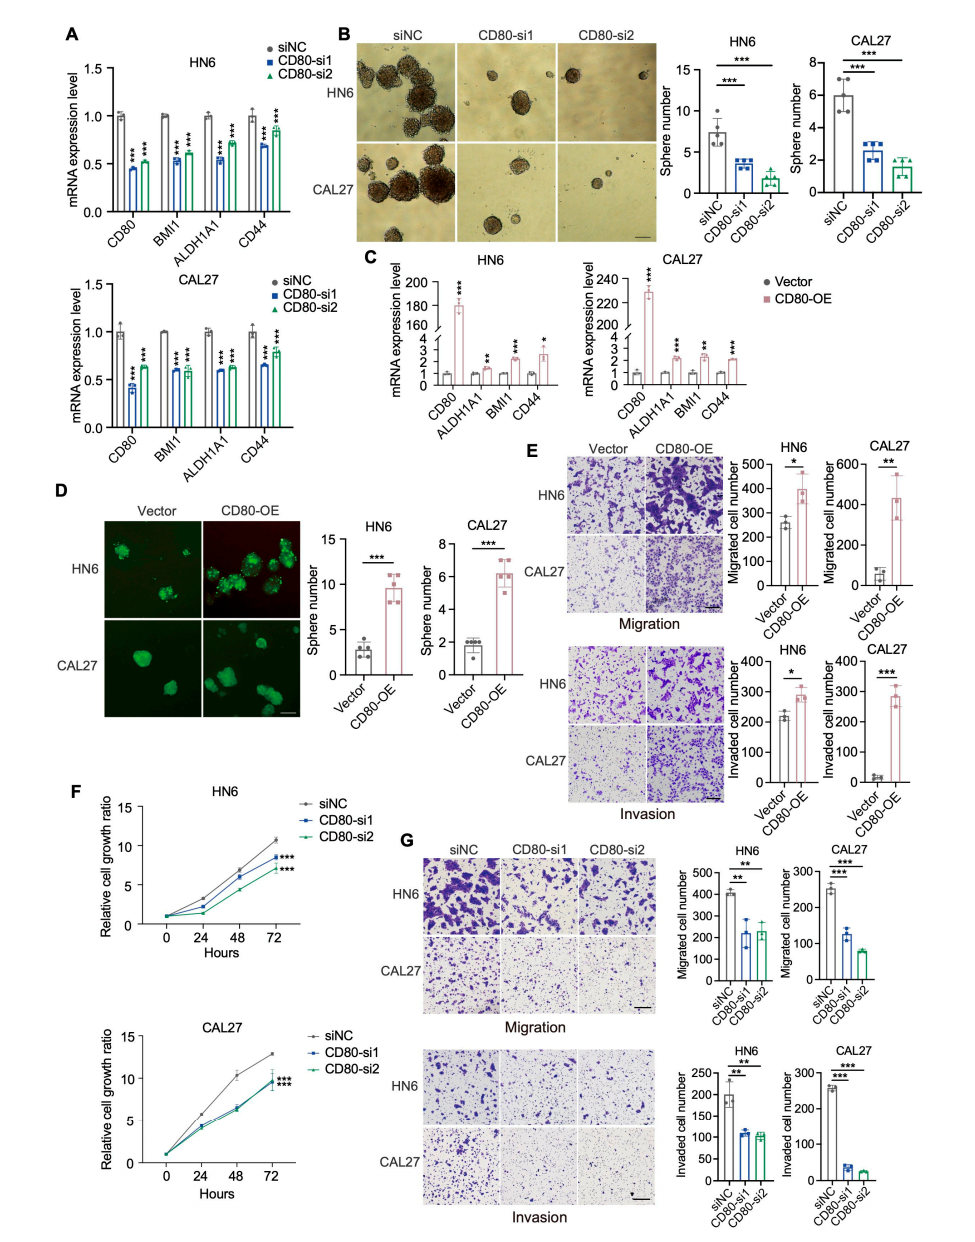 Figure 4. CD80 plays a crucial role in promoting cell stemness, proliferation, migration, and invasion. (A) RT?qPCR shows that knockdown of CD80 decreases the expression of stemness?related genes in HNSCC cells. Values are mean ± SD. *** p < 0.001; Two?way ANOVA test, n = 3. (B) Representative images of tumor spheres and quantification of the sphere number of HNSCC cells with knockdown of CD80. Scale bar, 200 μm. Values are mean ± SD. *** p < 0.001; One?way ANOVA test, n = 5. (C) RT?qPCR shows that overexpression of CD80 promotes the expression of stemness?related genes in HNSCC cells. Values are mean ± SD. * p < 0.05; ** p < 0.01; *** p < 0.001; Two?way ANOVA test, n = 3. (D) Representative images of tumor spheres and quantification of the sphere number of HNSCC cells with overexpression of CD80. Scale bar, 200 μm. Values are mean ± SD. *** p < 0.001; Student’s t test, n = 5. (E) Representative images and quantification of migration and invasion of HNSCC cell lines treated with CD80 overexpression. Scale bar, 100 μm. Values are mean ± SD. * p < 0.05; ** p < 0.01; *** p < 0.001; Student’s t test, n =3. (F) Knockdown of CD80 inhibits the cell proliferation of HNSCC cells. Values are mean ± SD. *** p < 0.001; Two?way ANOVA test, n = 3. (G) Representative images of tumor spheres and quantification of migration and invasion of HNSCC cell lines treated with CD80 knockdown. Scale bar, 100 μm. Values are mean ± SD. ** p < 0.01; *** p < 0.001; One?way ANOVA test, n =3.
图4 CD80调控干性与恶性表型
模块 4:RNA?seq 挖掘 CD80 调控抗肿瘤免疫通路
1.研究逻辑:CD80 敲低 / 过表达细胞转录组差异分析,GSEA 富集免疫相关通路,阐明 CD80 抑制 T 细胞活化的分子通路。
2.核心实验:mRNA 高通量测序、GO/KEGG 富集、GSEA 通路富集分析;
3.关键实验结果:
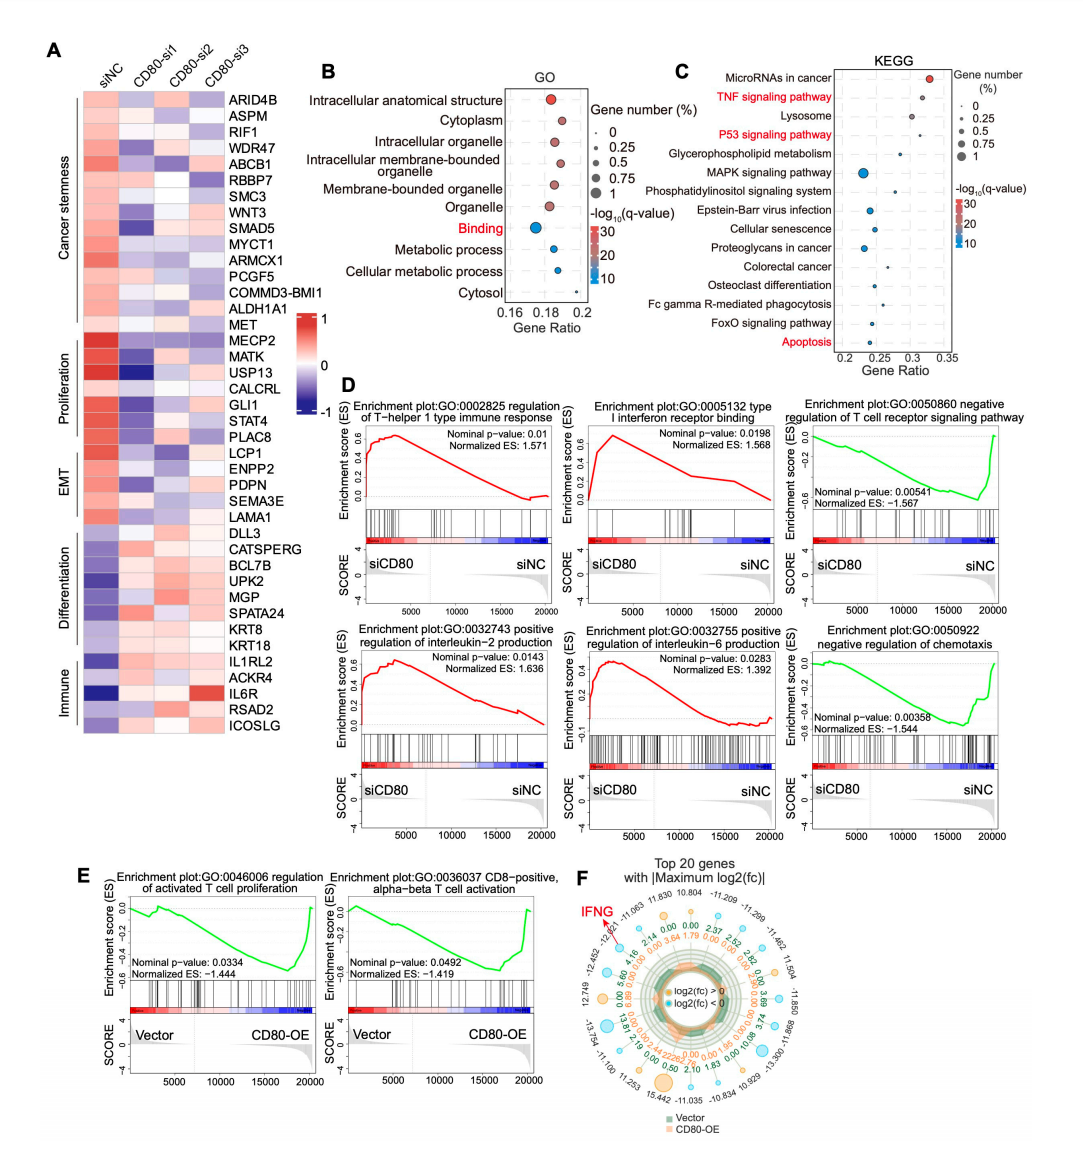 Figure 5. CD80 participates in antitumor immunity. (A) The Heatmap shows the gene expression profiles of HNSCC cells with the knockdown of CD80 by RNA?seq. (B) Top 10 enriched GO terms in HNSCC cells following CD80?si2 knockdown. (C) Top 15 enriched KEGG terms in HNSCC cells after CD80?si2 knockdown. (D) GSEA of the RNA?seq data from HNSCC cells with knockdown of CD80?si2. (E) GSEA of the RNA?seq data from HNSCC cells with overexpression of CD80. (F) Top 20 upregulated or downregulated genes in HNSCC cells with overexpression of CD80.
5 CD80调控免疫相关通路转录组分析
模块 5:体外共培养证实 CD80 阻断增强 T 细胞肿瘤杀伤
1.研究逻辑:健康人原代 CD3+T 细胞与 HNSCC 共培养,CD80 中和抗体干预,定量肿瘤凋亡,验证 CD80 直接抑制 T 细胞细胞毒。
2.核心实验:PBMC 分离、CD3+T 细胞纯化活化、肿瘤? T 细胞共培养、Calcein AM/PI 活死染色、胞内流式染色(Absin abs119676 抗 Caspase3 抗体);
3.Absin 产品使用步骤:收集共培养肿瘤细胞,Cyto?Fast 固定透膜后,加入 Absin abs119676 兔抗 Caspase3 一抗室温避光孵育 20min,洗涤后荧光二抗标记,流式检测 Caspase3 阳性凋亡细胞比例。
4.关键实验结果:
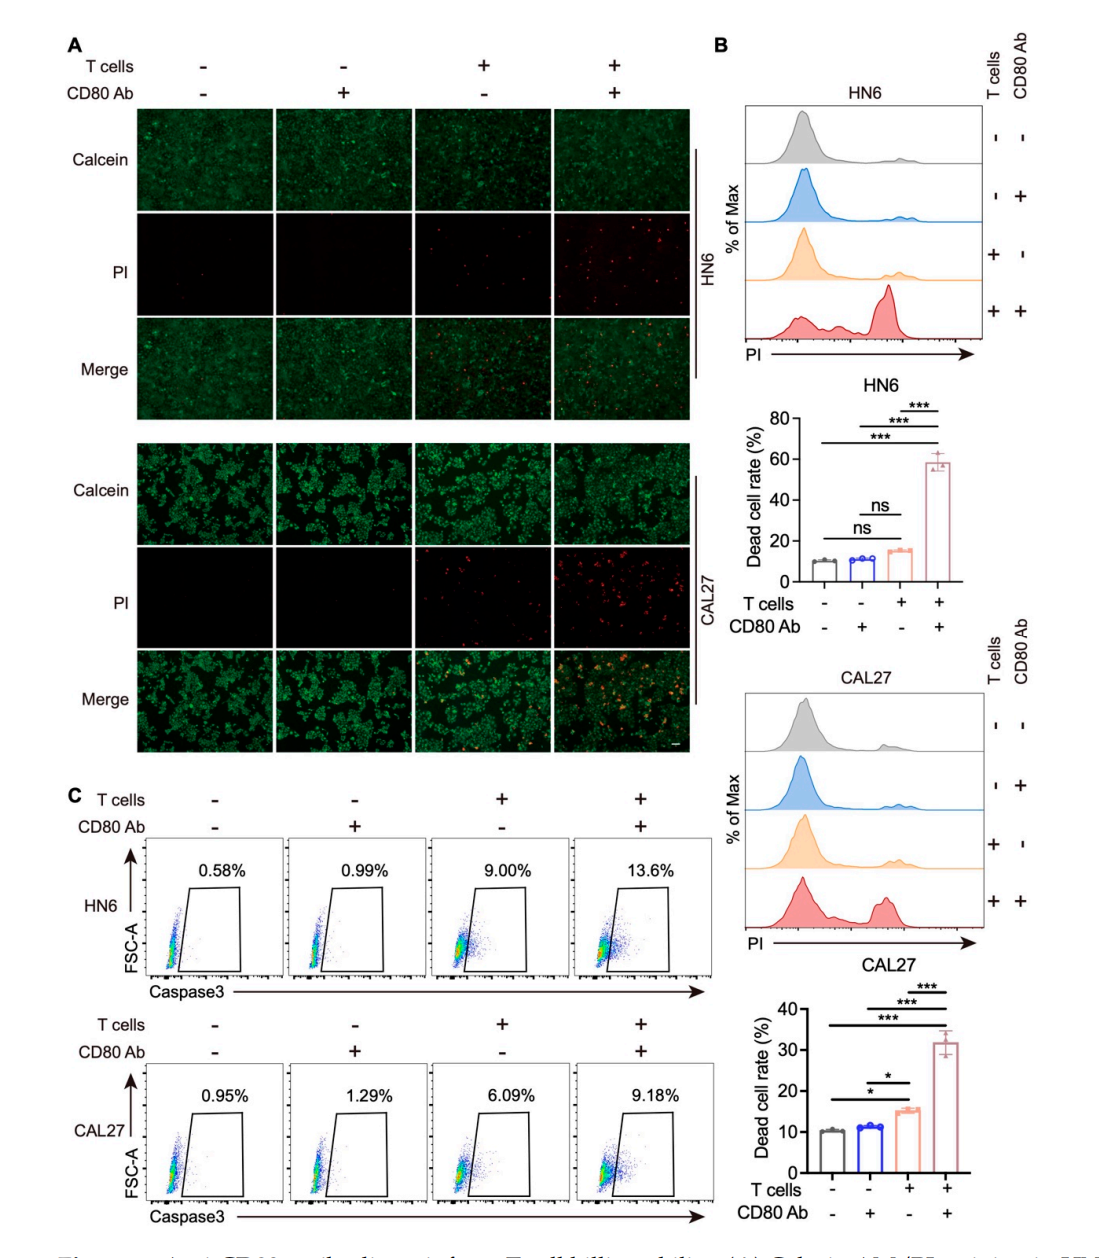 Figure 6. Anti?CD80 antibodies reinforce T?cell killing ability. (A) Calcein AM/PI staining in HNSCC cells after co?culture with or without T cells/anti?CD80 antibodies for 48 h. Scale bar, 200 μm. (B) Representative images and quantification of flow cytometry show the dead cell rate of HNSCC cells after co?culture with or without T cells/anti?CD80 antibodies for 48 h. Values are mean ± SD. ns, no significance; * p < 0.05; *** p < 0.001; One?way ANOVA test, n = 3. (C) Representative images of flow cytometry show the rate of caspase3+ HNSCC cells after co?culture with or without T cells/anti?CD80 antibodies for 48 h.
图6 CD80阻断增强T细胞杀伤(Caspase3流式检测)
模块 6:同基因小鼠体内验证 CD80 阻断抑瘤并重塑肿瘤免疫微环境
1.研究逻辑:口腔鳞癌同基因移植小鼠,CD80 中和抗体干预,监测肿瘤负荷;IHC 检测凋亡、CD8+T 浸润、杀伤效应分子,体内验证药效与免疫机制。
2.核心实验:C57BL/6 小鼠 MOC1/MOC2 皮下荷瘤、腹腔抗体给药、肿瘤体积重量监测、肿瘤组织 IHC 染色(Absin abs119676 抗 Caspase3 抗体、CD8、GZMB、Perforin、IFN?γ 抗体);
3.Absin 产品使用步骤:小鼠肿瘤组织石蜡切片脱蜡抗原修复,封闭后滴加 Absin abs119676 一抗 4℃孵育过夜,HRP 二抗孵育,DAB 显色,镜下半定量 Caspase3 阳性凋亡细胞 HIC 评分。
4.关键实验结果:
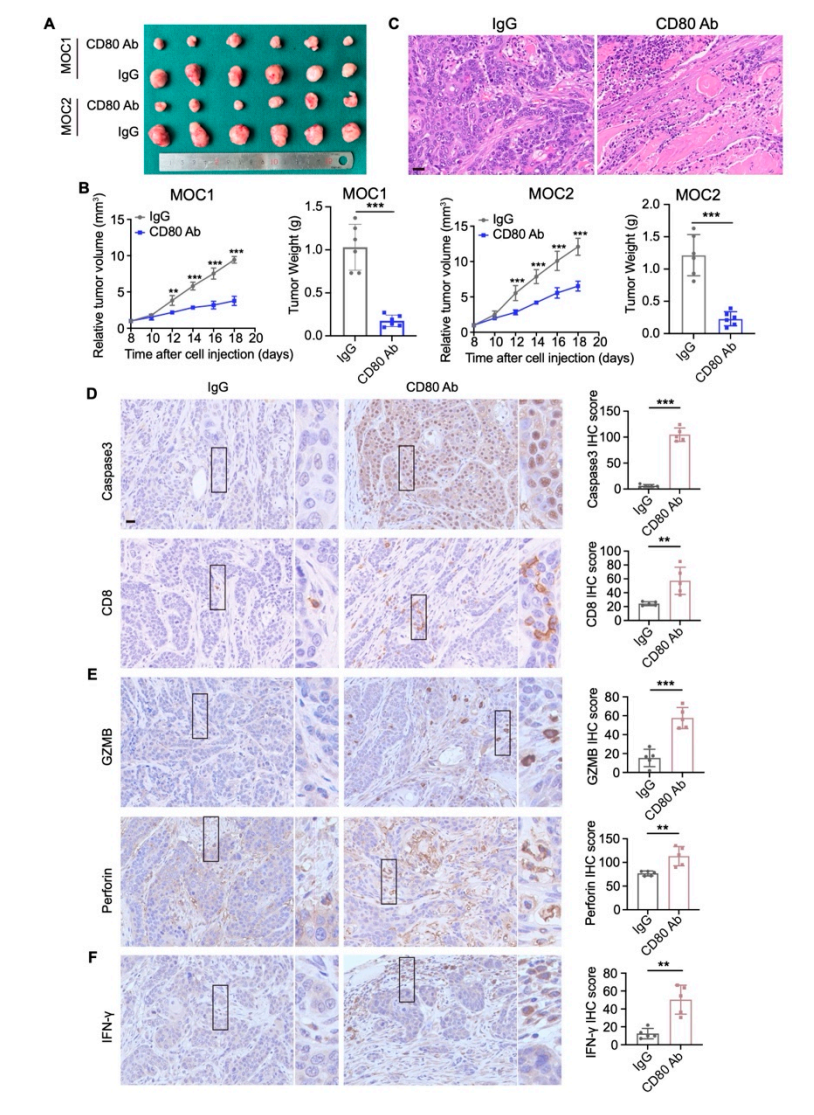 Figure 7. Blockade of CD80 inhibits HNSCC progression and enhances CD8+ T?cell function. (A) MOC1 and MOC2 cells were injected subcutaneously into C57BL/6 mice. Representative images show the tumors 18 days after implantation. (B) Tumor volume and tumor weight were significantly reduced in C57BL/6 mice treated with anti?CD80 antibody. Values are mean ± SD. ** p < 0.01; ***p < 0.001; Student’s t test; n = 6. (C) Representative H&E staining of tumors from mice injected with MOC2 cells. Scale bar, 25 μm. (D–F) Representative immunohistochemical staining and quantitative analysis of Caspase3, CD8, GZMB, Perforin, and IFN?γ from MOC2?bearing mice treated with isotypeIgG or anti?CD80 antibody. Scale bar, 40 μm. Values are mean ± SD. ** p < 0.01; *** p < 0.001; Student’s t test; n = 6.
7 小鼠体内CD80阻断抑瘤与免疫组化检测
五、Absin(abs119676 兔抗 Caspase3 多克隆抗体)产品整体作用总结
1.体外细胞凋亡定量核心标志物:在肿瘤细胞? T 细胞共培养流式胞内染色实验中,abs119676 特异性识别活化 Caspase3,精准定量 CD80 阻断后 T 细胞诱导的肿瘤凋亡比例,直观支撑 CD80 抑制 T 细胞杀伤的体外功能结论;
2.体内动物药效凋亡检测关键试剂:小鼠肿瘤组织免疫组化依靠该抗体可视化组织原位凋亡细胞,通过 HIC 半定量评分对比抗体干预组与对照组肿瘤凋亡水平,为 CD80 中和抗体体内抑瘤药效提供组织学分子证据;
3.串联体外? 体内完整凋亡证据链:该抗体同时适配流式细胞术、石蜡切片 IHC 两大主流凋亡检测平台,统一凋亡检测标志物,让细胞层面、动物层面的凋亡数据可横向对比,完整支撑 “阻断 CD80 恢复 T 细胞杀伤、诱导肿瘤凋亡” 核心机制论证,满足高分细胞生物学期刊体内外机制实验的质控标准,是本研究免疫功能与药效评价模块不可或缺的核心一抗试剂。

- 手机:13761418683