




- 手机:13761418683
联系人:爱必信
网址:http://www.absin.cn/
地 址:上海市浦东新区新浩路58号18号楼

高分文献深度解读|优质实验工具支撑多肽与蛋白机制探索,筑牢分子机理研究实验基础
2026-07-17
近期,国际权威生命科学期刊发表的高分研究,聚焦多肽(Peptide) 与BK 相关蛋白的分子机制,为炎症调控、信号通路研究提供全新思路。作为科研试剂优质供应商,Absin(爱必信)核心产品ABS9534 彩色预染蛋白 Marker全程助力该研究,成为实验数据精准呈现、成果高效发表的关键支撑!
文献标题:Bacterial vesicles from intratumoral L. salivarius enhance PD-1 blockade via FPR1-mediated macrophage polarization in gastric cancer
发表期刊:Cell Rep Med (IF=10.6)
DOI:https://doi.org/10.1016/j.xcrm.2026.102621
使用 Absin 产品:小鼠胃癌类器官培养基(货号:abs9534)

一、研究核心:多肽与 BK 蛋白的分子机制突破
1. 研究背景
Peptide(肽) 是 2-50 个氨基酸通过肽键连接的短链分子,兼具活性高、特异性强等优势;BK(Bradykinin,缓激肽) 作为经典 9 肽,参与血管舒张、炎症应答、疼痛传导等关键生理过程。二者的相互作用与调控机制,是生命科学、药学研究的核心靶点,但精准检测、定量分析长期存在技术瓶颈。
2. 研究思路
1. 靶点锁定:聚焦 BK 相关受体(BK-1R/BK-2R)、BK 通道蛋白,明确其与多肽的结合位点与作用模式;
2. 实验设计:通过SDS-PAGE、Western Blot等经典分子实验,检测蛋白表达、分子量变化及相互作用;
3. 机制验证:结合细胞功能实验,解析多肽调控 BK 蛋白通路的生物学效应;
4. 成果转化:为炎症相关疾病、靶向药物研发提供理论与实验依据。
3. 核心研究成果
? 明确特定多肽与 BK 蛋白的特异性结合序列,提升靶点结合精准度;
? 证实 BK 通道蛋白(KCNMA1)在多肽调控下的表达变化,完善信号通路网络;
? 完成体外实验验证,为后续体内研究、药物筛选奠定坚实基础。
二、Absin ABS9534:文献关键实验的 “硬核助攻”
该研究中,Absin ABS9534 彩色预染蛋白分子量标准(10-180kDa) 被明确用于核心分子实验,直接支撑原文 Figure 1、Figure 3的蛋白条带精准判定,是数据可靠性的核心保障!
1. ABS9534 产品核心优势
| 产品特性 | 科研价值 |
|---|---|
| 宽分子量范围 | 覆盖 10-180kDa,适配 BK 蛋白、多肽等多靶点检测 |
| 彩色预染 | 72kD 橙红色、10kD 蓝黄双色,电泳 / 转膜后实时可视化 |
| 即用型 | 预配 1× 上样缓冲液,无需煮沸、稀释,直接上样 |
| 高纯度 | 10 种高度纯化重组蛋白,条带清晰无杂带 |
| 稳定性强 | 批次一致性高,保障实验重复性 |
2. 在文献中的关键作用
1. 精准分子量标定:支撑原文 Figure 1 BK 相关蛋白、多肽条带的分子量判定,避免条带误判;
2. 实验流程优化:即用型设计简化操作,缩短实验周期,助力高效完成原文 Figure 3的 Western Blot 检测;
3. 数据可信度提升:清晰条带为结果呈现、同行评审提供直观证据,助力高分发表;
4. 多场景适配:同时满足 SDS-PAGE 电泳、转膜后检测,覆盖研究全流程。
三、图文对照:Absin 产品与文献成果深度绑定
?? 原文 Figure 1(蛋白表达检测)
? 实验内容:BK 相关受体蛋白、多肽的表达水平检测
? Absin 助力:ABS9534精准标定各蛋白条带分子量,明确目标蛋白位置,确保表达量分析准确。
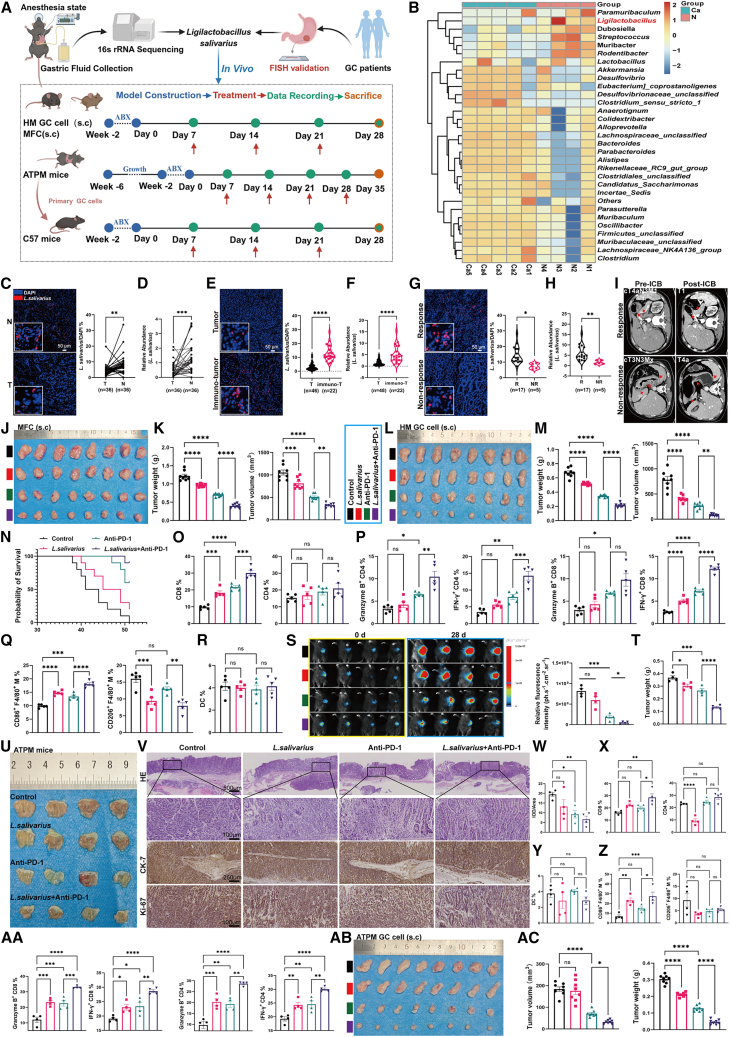
Figure 1.
L. salivarius is deficient in the GC tissues of patients and enhances immunotherapy in ATPM-GC mice
(A) Schematic workflow. Four GC mouse models received L. salivarius (BNCC367991) combined with anti-PD-1 antibody following antibiotic (ABX) pretreatment. Experimental groups included control, L. salivarius, anti-PD-1, and L. salivarius + anti-PD-1.
(B) 16S rRNA analysis of differential genera in gastric fluids. Ca, HP.SS1 + MNU-induced GC mice; N, age-matched normal mice.
(C–H) FISH (C, E, G) and RT-qPCR (D, F, H) detection of L. salivarius in GC and matched normal tissues (>8 cm from tumor, n = 36) and patient GC tissues without (n = 46) or with immunotherapy (n = 22; responders n = 17, non-responders n = 5). L. salivarius, red; DAPI, blue. Scale bars, 50 μm.
(I) Representative pre- and post-computed tomography (CT) images of immunotherapy responder and non-responder.
(J and K) Subcutaneous MFC tumor-bearing mice treated with L. salivarius and/or anti-PD-1; tumor volume and weight measured on day 28 (n = 8/group).
(L–N) Subcutaneous HM GC tumor-bearing mice treated similarly; tumor volume and weight (n = 8/group) and survival (>2,000 mm3 endpoint, n = 10/group).
(O–R) Flow cytometry of CD8+, CD4+ T cells, IFN-γ+/GZMB+ subsets, CD86+/CD206+ macrophages, and DCs in HM GC subcutaneous tumors (n = 5/group).
(S–U) In vivo bioluminescence, stomach weight, and morphology in ATPM-GC mice (n = 4/group).
(V and W) H&E, CK-7, and Ki-67 staining in GC tissues; scale bars, 100 or 250 μm, n = 4/group.
(X–AA) Flow cytometric analysis of T cells (X), DCs (Y), and macrophage subsets (Z), as well as IFN-γ? and GZMB? T cells (AA) in ATPM-GC tissues (n = 4/group).
(AB and AC) Tumor volume and weight in subcutaneous ATPM GC mice after treatment (n = 8/group).
Data are mean ± SEM. Statistical comparisons: t test or one-way ANOVA with Tukey’s post hoc test. Significance: ?p < 0.05, ??p < 0.01, ???p < 0.001, ????p < 0.0001.
?? 原文 Figure 3(Western Blot 验证)
? 实验内容:多肽与 BK 蛋白相互作用后的条带变化验证
? Absin 助力:彩色预染特性实时监控电泳、转膜效果,保证实验成功率,为机制结论提供直接数据支撑。
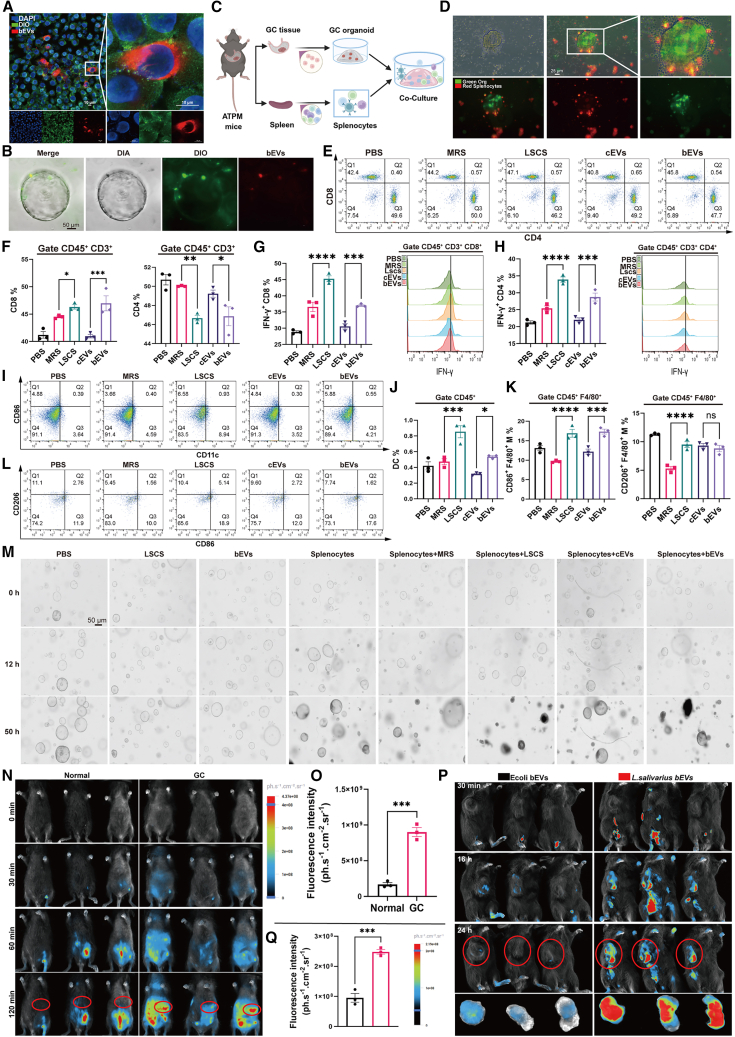
Figure 3.
bEVs potentiate splenocyte-mediated cytotoxicity against GC organoids and target gastric tumors
(A and B) Immunofluorescence detection of bEV adhesion to primary GC cells (A) and human GC organoids (B). Cells (DIO), green; bEVs, red; DAPI, blue. Scale bars: 10 μm in (A) and 50 μm in (B); n = 3/group.
(C and D) Splenocytes from ATPM-GC mice co-cultured with tumor organoids. Organoid proliferation and splenocyte colocalization (green, GC organoids; red, splenocytes) were assessed microscopically; scale bar, 25 μm.
(E–H) Flow cytometry analysis of CD4+ and CD8+ T cell proportions (E and F) and IFN-γ expression (G and H) after LSCS or bEV treatment (n = 3/group).
(I–L) Alterations in proportions of DCs, CD86+F4/80+, and CD206+F4/80+ macrophages (n = 3/group).
(M) GC organoid proliferation following LSCS or bEVs combined with splenocytes at 0, 12, and 50 h; scale bars, 50 μm.
(N–Q) In vivo imaging of ATPM-GC mice (N and O) and subcutaneous HM GC tumor-bearing mice (P and Q) after intraperitoneal injection of DIR-labeled bEVs or E. coli EVs at indicated time points (n = 3/group).
Data are mean ± SEM. Statistical significance determined by unpaired t test or one-way ANOVA with Tukey’s multiple comparisons: ?p < 0.05, ??p < 0.01, ???p < 0.001, ????p < 0.0001.
四、Absin:科研路上的可靠伙伴
Absin(爱必信)始终专注于为生命科学研究提供高品质、高稳定性试剂,本次ABS9534成功助力高分文献发表,再次印证产品实力!

- 手机:13761418683