




- 手机:13761418683
联系人:爱必信
网址:http://www.absin.cn/
地 址:上海市浦东新区新浩路58号18号楼

- 耐药病灶呈现显著的细胞外基质(ECM)重构,胶原密集、基质僵硬;
- 病灶高度免疫抑制,细胞毒性 T 细胞耗竭,Treg 大量浸润;
- 透明质酸(HA)异常沉积,但HA 如何调控免疫微环境、介导耐药尚不明确。
- 临床分层:对比治疗敏感 / 耐药胃癌腹膜转移灶的 ECM 与免疫表型;
- 组学筛选:单细胞测序解析 HA 高 / 低组的免疫细胞图谱;
- 细胞功能:体外验证 HA CD44 对 CD4+T 细胞向 Treg 分化的调控;
- 动物验证:构建人源化与同源小鼠腹膜转移模型,验证 CD44 阻断的治疗效果;
- 机制深挖:通过免疫共沉淀(Co IP)+ 质谱,鉴定 CD44 下游关键互作蛋白与信号轴。
- 耐药病灶HA 显著富集,胶原 I 高表达,弹性纤维减少;
- HA 高表达患者生存期显著缩短,是独立不良预后因素;
- HA 累积源于肿瘤细胞 HA 降解酶(HYAL1/2)下调,而非合成增加。
- 单细胞测序显示:HA 高组CD8 + 耗竭 T 细胞、Treg 显著增加,细胞毒性 T 细胞减少;
- CD44+CD4+FOXP3+Treg 是 HA 高病灶的特征免疫亚群;
- 空间多色免疫组化(mIHC)证实:Treg 定位于 HA 富集区域,CD8+T 细胞被排斥。
- 高效富集生理状态下的蛋白复合物:试剂盒含重组 rProtein A/G 磁珠,广谱结合多物种、多亚型抗体,温和裂解体系完整保留 CD44 IQGAP1 RAC1 天然互作,避免体外过表达的假阳性。
- 低非特异性结合,背景干净:磁珠法替代传统琼脂糖珠,非特异性吸附极低,确保质谱仅鉴定特异性互作蛋白,精准锁定 IQGAP1 与 RAC1。
- 兼容下游 WB 与质谱:优化洗脱体系,既可用于 Western Blot 验证互作,也可直接进行质谱分析,一套试剂盒完成 “互作验证 + 新蛋白筛选”,大幅提升实验效率。
- HA 结合 CD44,招募 IQGAP1 并激活 RAC1;
- 活化 RAC1 促进 SMAD3 磷酸化,入核驱动 FOXP3 转录,促进 Treg 分化;
- 形成免疫抑制微环境,导致化疗与 PD 1 抑制剂耐药。
- 动物模型:CD44 抗体显著减少腹膜转移结节,延长生存期;
- 联合治疗:anti CD44+anti PD 1协同降低 Treg 比例,恢复 CD8+T 细胞功能;
- 临床样本:CD44+Treg 比例高的患者,免疫治疗疗效更差。
- 全新机制:首次建立ECM 重构→HA 沉积→CD44 激活→Treg 分化→免疫抑制→治疗耐药的完整通路;
- 全新靶点:CD44 是胃癌腹膜转移免疫治疗的全新靶点;
- 全新策略:CD44 抑制剂联合 PD 1 抑制剂,有望破解晚期胃癌腹膜转移耐药难题。
顶刊重磅|HA-CD44 信号轴揭示胃癌腹膜转移耐药关键机制
2026-07-13
近期,国际权威期刊《Journal for Immunotherapy of Cancer》发表了复旦大学附属中山医院团队的重磅研究,首次揭示透明质酸(HA)CD44 信号轴通过重塑肿瘤微环境、驱动调节性 T 细胞(Treg)分化,介导胃癌腹膜转移(PM)治疗抵抗与免疫抑制的全新机制。该研究从临床样本出发,结合单细胞测序、动物模型与分子互作实验,完整阐明了 “基质重构 免疫抑制 治疗耐药” 的链式通路,为晚期胃癌免疫治疗提供全新靶点。
值得关注的是,研究中关键分子互作验证全程使用 Absin 核心试剂 abs9649(rProtein A/G Magnetic IP/Co IP Kit),为 CD44 IQGAP1 RAC1 新信号通路的发现提供了硬核技术支撑!
文献标题:Hyaluronic acid-CD44 signaling defines therapeutic resistance and immunosuppressive microenvironment in peritoneal metastasis of gastric cancer
发表期刊:J Immunother Cancer. (IF=10.6)
DOI:https://doi.org/10.1136/jitc-2025-014179
使用 Absin 产品:免疫(共)沉淀(IP/CoIP)试剂盒(磁珠法)(货号:abs9649)

一、研究背景:胃癌腹膜转移的 “临床死穴”
腹膜转移是晚期胃癌最常见、最凶险的转移类型,患者中位生存期仅 3-9 个月,传统化疗与免疫治疗效果极差。临床发现:
本研究以此为切入点,系统解析 HA CD44 轴在胃癌腹膜转移中的作用机制。
二、研究思路:从临床表型到分子机制的完整闭环
研究采用 “临床分层→组学筛选→细胞功能→动物验证→机制深挖” 的经典高分思路:
三、核心成果:HA CD44 IQGAP1 RAC1 SMAD3 新通路
1. HA 沉积是胃癌腹膜转移耐药的核心标志物(对应原文图 1)
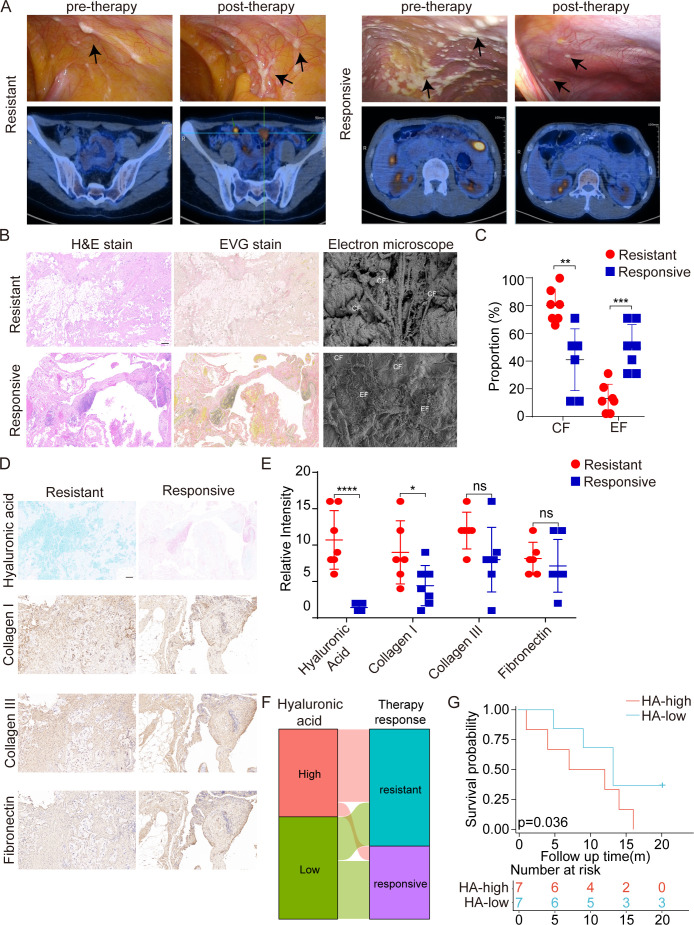 Figure 1.
Elevated hyaluronic acid (HA) in peritoneal metastasis correlates with therapy resistance and poor prognosis. (A) Laparoscopic and radiologic evaluation of peritoneal lesions before and after chemotherapy in therapy-resistant (‘Resistant’) and therapy-responsive (‘Responsive’) patients with GC. Top panels: Laparoscopic images show scattered peritoneal nodules (black arrows) in cases. Bottom panels: Corresponding axial PET–CT (Positron Emission Tomography and Computed Tomography) images reveal persistently 18F-FDG (Fluorodeoxyglucose)–avid lesions before and after therapy. (B) Histopathological characterization of peritoneal tumor nodules using H&E, Elastica van Gieson (EVG) staining, and scanning electron microscopy (SEM). Scale bars: H&E and EVG, 100 μm; SEM, 10 μm. (C) Quantitative analysis of CF (collagen fibers) and EF (elastic fibers) area fractions in B. (D) Representative alcian blue staining for HA and immunohistochemical detection of collagen I, collagen III, and fibronectin in Resistant and Responsive peritoneal lesions. Scale bars, 50 μm. (E) Semiquantitative scoring of HA, collagen I, collagen III, and fibronectin staining intensities in Resistant (red circles) and Responsive (blue squares) lesions. (F) Alluvial diagram illustrating the association between HA level (‘High’ vs ‘Low’) and clinical response to therapy (‘Resistant’ vs ‘Responsive’). (G) Kaplan–Meier survival analysis stratified by HA level in peritoneal metastases. Data represent mean±SD?from five independent patient samples per group. *p?<?0.05, **p?<?0.01, ***p?<?0.001, ****p<0.0001, ns, not significant.
2. HA 重塑免疫微环境,富集 CD44+Treg(对应原文图 2、3)
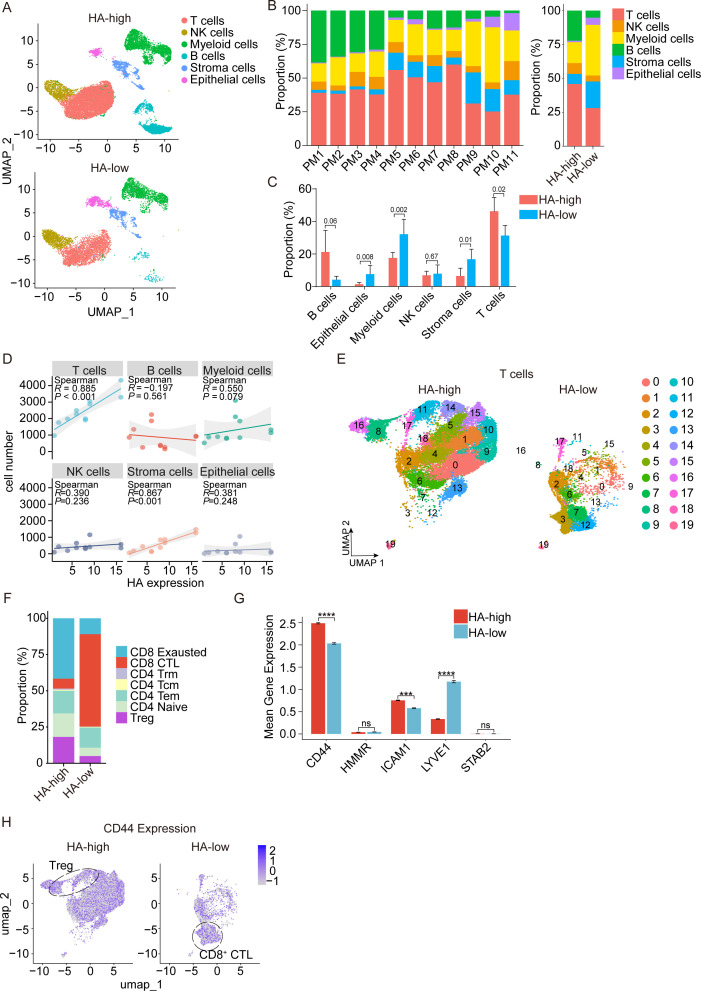 Figure 2.
Hyaluronic acid (HA) level correlates with immune landscape remodeling and CD44-associated T cell subset enrichment in peritoneal metastases. (A) UMAP embedding of single-cell transcriptomes from HA-high (top) and HA-low (bottom) peritoneal metastases. (B) Left: Stacked bar charts depicting the proportion of each cell lineage in individual patient samples PM1–PM11. Right: Aggregate comparison of lineage proportions between the HA-high and HA-low groups. (C) Quantification of lineage proportions in HA-high (red) versus HA-low (blue) lesions. Error bars represent mean±SD; unpaired t-tests. (D) Correlation analysis between HA staining intensity and absolute cell numbers for each lineage across all samples. Spearman correlation coefficients (R) and p values are indicated for each cell type. (E) UMAP visualization of T cell clusters subtyped into 20 discrete subsets (0–19) in HA-high (left) and HA-low (right) conditions. (F) Stacked bar chart showing the percentage of T cell functional subsets in HA-high and HA-low groups. (G) Mean normalized expression of hyaluronan receptor genes CD44, HMMR, ICAM1, LYVE1, and STAB2 in T cells from HA-high (red) versus HA-low (blue) samples. Error bars denote mean±SD; unpaired t-tests. (H) Feature plots overlaying CD44 expression onto T cell UMAPs for HA-high (left) and HA-low (right) conditions, highlighting CD44 enrichment in regulatory T cells (Tregs) (circled) under HA-high and in CD8 CTL (circled) under HA-low environments. ***p?<?0.001, ****p?<?0.0001, ns, not significant.
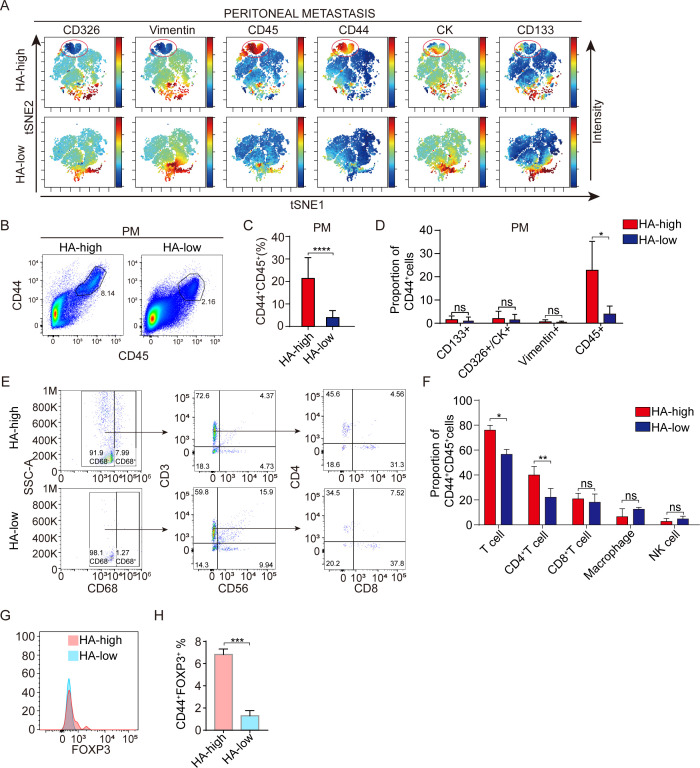 Figure 3.
CD44+CD4+ T cells enrich in hyaluronic acid (HA)-high peritoneal metastases and define a Treg niche. (A) v-SNE maps showing expression intensity of CD326, vimentin, CD45, CD44, cytokeratin (CK), and CD133 in single-cell suspensions from HA-high (top row) and HA-low (bottom row) peritoneal metastases. CD45+CD44+ clusters (circled) are prominent only in HA-high samples. Color bars denote normalized expression. (B) Representative flow cytometry dot plots gating CD45 versus CD44 in fresh peritoneal metastasis (PM) samples from HA-high and HA-low groups. The percentage of CD44+CD45+ cells is indicated. (C) Quantification of CD44+CD45+ cell frequency in HA-high (red) versus HA-low (blue) metastases (mean±SD; ****p<0.0001, unpaired t-test; n=6?per group). (D) Proportion of CD44+ cells coexpressing CD133, CD326/CK, vimentin, or CD45 in HA-high (red) and HA-low (blue) groups (*p<0.05; ns, not significant). (E) Sequential gating strategy for HA-high (top) and HA-low (bottom) PM samples. Left plots: CD68 versus SSC-A (Side Scatter Area) to exclude macrophages. Middle plots: CD3 versus CD56 to identify T cells and natural killer (NK) cells. Right plots: CD4 versus CD8 within CD3+ cells. (F) Proportion of CD44+CD45+ cells belonging to T cells, CD4+ T cells, CD8+ T cells, macrophages, or NK cells in HA-high (red) versus HA-low (blue) samples. (*p<0.05, **p<0.01). (G) Representative overlaid histograms of FOXP3 expression in CD44+CD45+ T cells from HA-high (red) and HA-low (blue) samples. (H) Quantification of FOXP3+ Treg frequency among CD44+CD45+ cells in HA-high versus HA-low metastases (mean±SD; ***p<0.001; unpaired t-test). Treg, regulatory T cell.
3. Absin abs9649 助力发现 CD44 IQGAP1 RAC1 新复合物(对应原文图 6)
这是本研究最核心的机制突破:
研究团队从胃癌腹水分离 CD4+T 细胞,使用Absin abs9649 磁珠法免疫共沉淀试剂盒富集 CD44 蛋白复合物,联合质谱鉴定,首次发现 CD44 与 IQGAP1、RAC1 形成稳定复合物。
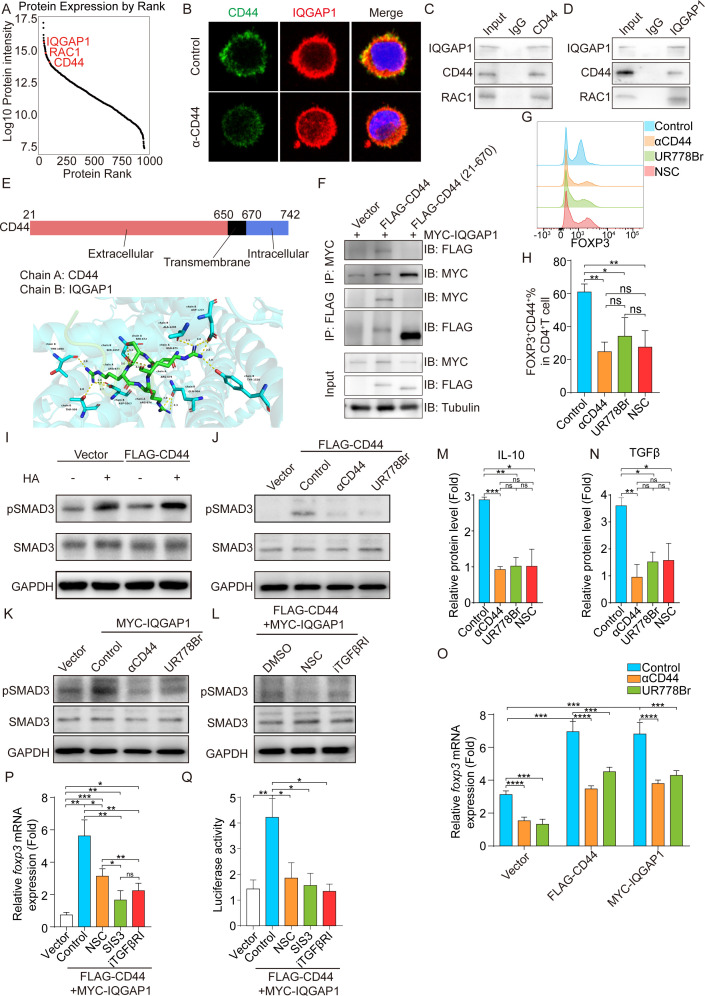 Figure 6.
CD44 physically interacts with IQGAP1 to activate RAC1–SMAD3 signaling and FOXP3 transcription.(A) Rank-ordered abundance of proteins identified by mass spectrometry in CD44+ Tregs lysate. CD44, IQGAP1, and RAC1 (red labels) rank among the top 1% of detected proteins. (B) Confocal immunofluorescence of control or anti-CD44 treated CD44+ Tregs stained for CD44 (green) and IQGAP1 (red). Merge panels (right) include DAPI (blue). Scale bar=10?μm. (C,D) Co-immunoprecipitation of CD44 and IQGAP1 from cell lysates. Input and IgG controls are shown. (E) Schematic of CD44 domain architecture (amino acids 21–742) with extracellular (red), transmembrane (black), and intracellular (blue) regions (top), and molecular docking model depicting interaction interface between CD44 extracellular domain and IQGAP1 (bottom). Key interacting residues are highlighted. (F) Co-IP in CD44+ Tregs transfected with FLAG-CD44 full-length or FLAG-CD44 (21–670) truncation and MYC-IQGAP1. Tubulin serves as loading control. (G–H) In vitro Treg induction assay measuring FOXP3 expression in CD4+ T cells stimulated in the presence of control, anti-CD44, UR778Br (IQGAP1 inhibitor), or NSC23766 (RAC1 inhibitor). (G) Representative flow cytometry histograms. (H) Quantification of CD44+FOXP3+ T cells (mean±SD; **p<0.01, *p<0.05; t test). (I–L) Western blots assessing SMAD3 phosphorylation in CD44+CD4+ T cells under various perturbations. GAPDH serves as loading control. (M,N) ELISA quantification of IL-10 (M) and TGF-β (N) in conditioned medium from CD4+ T cell cultures under control, αCD44, UR778Br, or NSC23766 treatment (mean fold change±SD; **p<0.01, *p<0.05; t test). (O–Q) FOXP3 transcriptional activation assays. (O) Quantitative real-time PCR (qRT-PCR) of foxp3 mRNA in CD4+ T cells transfected with vector, FLAG-CD44, or MYC-IQGAP1 (mean fold change±SD; ***p<0.001, ****p<0.0001; t test). (P) foxp3 mRNA levels in FLAG-CD44?+?MYC-IQGAP1 cells treated with control, NSC23766, SIS3 (smad3 inhibitor) or iTGFβRI (TGFβRI inhibitor) treatment (mean fold change±SD; **p<0.01, *p<0.05; t test). (Q) Luciferase reporter assays of foxp3 promoter activity under same conditions as (P) (mean±SD; **p<0.01, *p<0.05; t test). ns, not significant; Treg, regulatory T cell.
? Absin abs9649 在本研究中的核心作用
关键实验结论:
4. CD44 阻断 + PD 1 抑制剂协同逆转耐药(对应原文图 7)
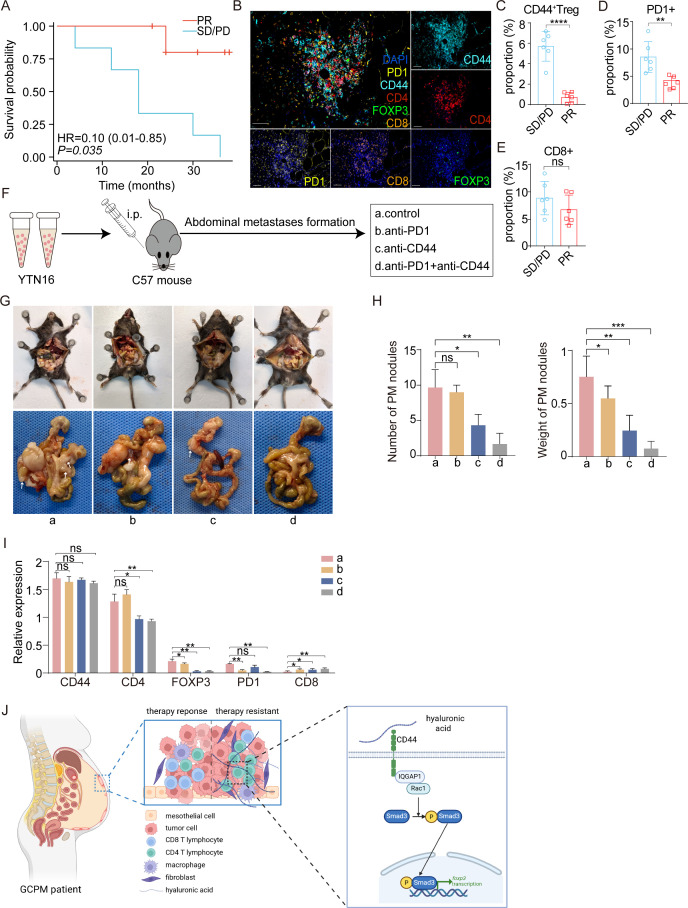 Figure 7.
CD44+ Tregs correlate with immunotherapy resistance, and combined CD44/PD-1 blockade enhances therapeutic efficacy in peritoneal metastasis (A) Kaplan-Meier survival analysis of patients with gastric cancer (GC) receiving immunotherapy, stratified by treatment response. Patients achieving partial response (PR, yellow) showed improved survival compared with those with stable/progressive disease (SD/PD, blue). HR=0.21 (95% CI 0.06 to 0.74), log-rank test p=0.075. (B) Representative multiple immunohistochemistry (mIHC) imaging of peritoneal metastatic tissue from patients with GC. Merged image (left) shows spatial distribution of immune markers: DAPI (blue, nuclei), PD1 (yellow), CD4 (red), FOXP3 (green), CD8 (orange), and CD44 (cyan). Individual channel images (right panels) demonstrate CD44, CD4, and FOXP3 expression patterns. Scale bar=50?μm. (C–E) Quantitative analysis of immune cell infiltration in peritoneal metastases from patients with different immunotherapy responses. (F) Experimental design for combination therapy study. YTN16 gastric cancer cells were injected intraperitoneally into C57BL/6?mice, followed by treatment with: (a) control, (b) anti-PD1, (c) anti-CD44, or (d) anti-PD1 and anti-CD44 combination therapy. (G) Representative image of mice corpse and peritoneal metastases at the endpoint. Upper panels show in situ peritoneal tumors; lower panels show excised tumor nodules. (H) Quantification of therapeutic efficacy shown in G. (I) Quantification of CD44, CD4, FOXP3, PD-1, and CD8 immunofluorescence intensity in peritoneal tumors from each treatment group normalized to control (a). (J) Schematic model illustrating HA-CD44-IQGAP1-RAC1-SMAD3 signaling cascade in CD4+ T cells: HA engagement of CD44 recruits IQGAP1 and activates RAC1, driving SMAD3 phosphorylation, nuclear translocation, and FOXP3 transcription to promote Treg differentiation and immune suppression in therapy-resistant metastases. Data represent mean±SD; n=3 independent experiments. *p<0.05, **p<0.01, ***p<0.001, ****p<0.0001?and ns, not significant.
四、Absin abs9649:高分文章的 “机制验证神器”
| 产品信息 | 核心优势 | 本研究应用场景 |
|---|---|---|
|
货号:abs9649 名称:rProtein A/G Magnetic IP/Co IP Kit |
1. 重组 A/G 磁珠,广谱结合抗体 2. 磁珠法,快速分离,无需离心 3. 低非特异结合,背景干净 4. 兼容 WB、质谱、qPCR |
1. CD44 与 IQGAP1 内源性互作验证 2. CD44 结构域截断突变互作验证 3. CD44 复合物质谱鉴定新互作蛋白 |
五、研究意义与临床转化
六、Absin 助力科研,持续赋能高分文章
从临床问题到分子机制,从细胞实验到动物验证,Absin 始终以高品质试剂支撑科研工作者攻克临床难题。本次 abs9649 成功助力 JITC 顶刊研究,再次验证 Absin 试剂的稳定性、特异性与可靠性。

- 手机:13761418683