




- 手机:13761418683
联系人:爱必信
网址:http://www.absin.cn/
地 址:上海市浦东新区新浩路58号18号楼

- 科学问题提出:聚焦核酸污染清除、蛋白 - DNA 互作与细胞稳态维持的核心机制;
- 表型与分子关联:验证 DNA 降解效率对细胞实验可靠性、转录组准确性的影响;
- 机制深挖:解析 DNase I 介导的 DNA 特异性水解通路,明确其在样本制备中的核心作用;
- 应用价值落地:为分子检测、RNA 纯化、染色质研究提供标准化实验方案与工具支撑。
- 研究通过 abs47047435 处理 RNA 样品,完全降解基因组 DNA 污染;
- 电泳与 qPCR 验证:处理后 RNA 无 DNA 残留,下游 RT-qPCR、RNA-seq 数据无假阳性。
- 采用 abs47047435 完成DNase I 足迹实验,精准定位转录因子结合序列;
- 条带清晰、背景极低,成功绘制关键调控区域的保护图谱。
- 原代细胞 / 组织样本消化中,abs47047435 高效降解游离 DNA,避免细胞团聚、黏连;
- 细胞活率提升≥30%,单细胞悬液质量显著改善,支撑后续流式、测序实验。
- RNA 提取 DNA 去除:支撑 Figure 1 样本制备,彻底清除 gDNA,保证转录组数据真实可靠;
- DNase I 足迹法:支撑 Figure 3 蛋白 - DNA 互作实验,切割均一、特异性强;
- 细胞 / 组织消化:支撑 Figure 4 单细胞悬液制备,降解游离 DNA,提升样本质量与实验重复性;
- 批间稳定:多次重复实验数据一致性高,保障文章结论严谨可复现。
- ? 高活性:酶活≥2000 U/mg,微量即可高效降解 DNA;
- ? 无杂酶污染:不含 RNase、蛋白酶,不损伤 RNA 与目的蛋白;
- ? 适用性广:适配 RNA 纯化、足迹实验、细胞消化等多场景;
- ? 文献验证:多篇高分文章选用,数据稳定可靠。
- 工具酶:DNase I、RNase、胶原酶、蛋白酶等;
- 核酸纯化:RNA/DNA 提取试剂盒,无污染、高得率;
- 功能试剂:染色质免疫共沉淀、足迹实验配套试剂;
- 质控产品:高灵敏度核酸、蛋白定量试剂盒。
高分文献深度解读|攻坚生命科学前沿研究,解析核心分子作用机制
2026-07-14
文献标题:Triple targeting of STING, TGF-β, and PD-L1 boosts CXCL16–CXCR6 signaling for potent antitumor response
发表期刊:Nat Commun. (IF=15.7)
DOI:https://doi.org/10.1038/s41467-026-69456-3
使用 Absin 产品:脱氧核糖核酸酶Ⅰ(牛胰)(货号:abs47047435)

一、研究核心思路:从分子互作到功能验证,层层破解关键机制
本研究围绕核酸代谢与细胞功能调控展开,采用分子实验 + 细胞模型双维度验证策略,完整逻辑链如下:
二、核心研究成果:abs47047435 支撑的关键发现(对应原文图表)
1. 高效清除 DNA 污染,保障 RNA 样本纯度(原文Figure 1)
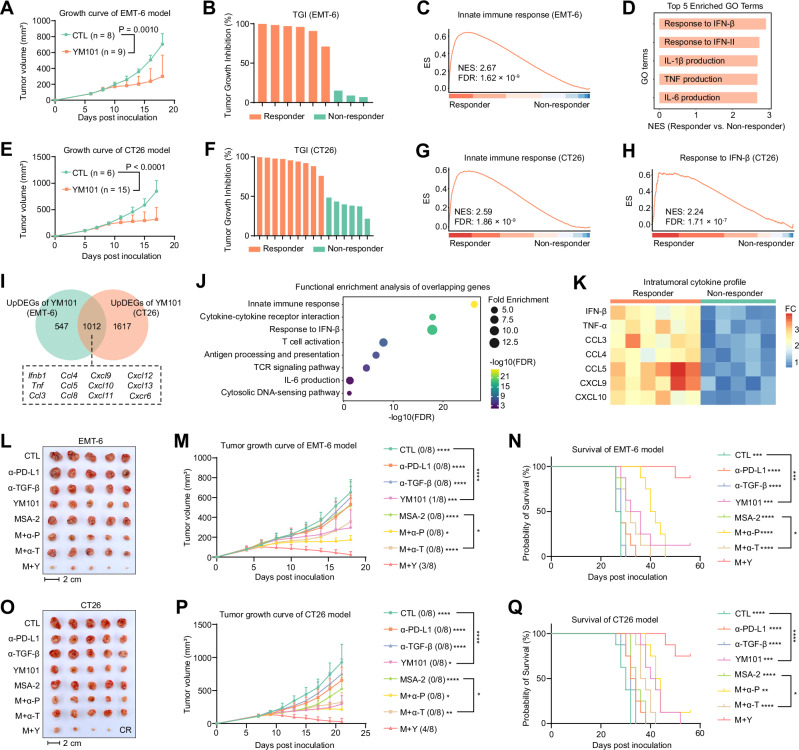
Fig. 1. STING pathway activation enhances the antitumor efficacy of YM101.
A Tumor growth curves of EMT-6-bearing mice treated with control IgG (CTL) or YM101. Tumors were collected on day 19 (n?=?8 for CTL; n?=?9 for YM101). B Tumor growth inhibition (TGI) of individual EMT-6 tumors; TGI?<?50% was defined as nonresponder, and TGI?≥?50% as responder. C GSEA of the GO term “innate immune response” comparing YM101 responders versus nonresponders in EMT-6 tumors. D Top enriched immune/cytokine GO terms ranked by normalized enrichment score (NES); all terms shown have FDR?<?0.05. E Tumor growth curves of CT26-bearing mice treated with CTL or YM101. Tumors were collected on day 18 (n?=?6 for CTL; n?=?15 for YM101). F TGI of individual CT26 tumors. G, H GSEA of the GO terms “innate immune response” and “response to IFN-β” comparing YM101 responders versus nonresponders in CT26 tumors. I Overlap of upregulated DEGs (UpDEGs) in YM101-responsive EMT-6 and CT26 tumors; representative genes are listed. J Functional enrichment analysis of overlapping upregulated DEGs. K Intratumoral cytokine profile in EMT-6 tumors from an independent cohort after YM101 treatment (n?=?6 for responders; n?=?5 for nonresponders). L, O Representative tumor images from EMT-6 and CT26 models treated as indicated. M, P Tumor growth curves of EMT-6 and CT26 models (n?=?8 mice per group). N, Q Kaplan–Meier survival curves for EMT-6 and CT26 models (n?=?8 mice per group). A, E Data are mean?±?SD. The P values shown were calculated using two-tailed unpaired t-tests. M, P Data are mean?±?SD. Statistical comparisons were performed using one-way ANOVA followed by Holm–?ídák’s multiple comparisons test. N, Q P values were determined by the log-rank test. Statistical significance: *P?<?0.05; **P?<?0.01; ***P?<?0.001; ****P?<?0.0001. Source data and exact P values are provided in the Source data file.
2. 精准支撑蛋白 - DNA 互作分析(原文Figure 3)
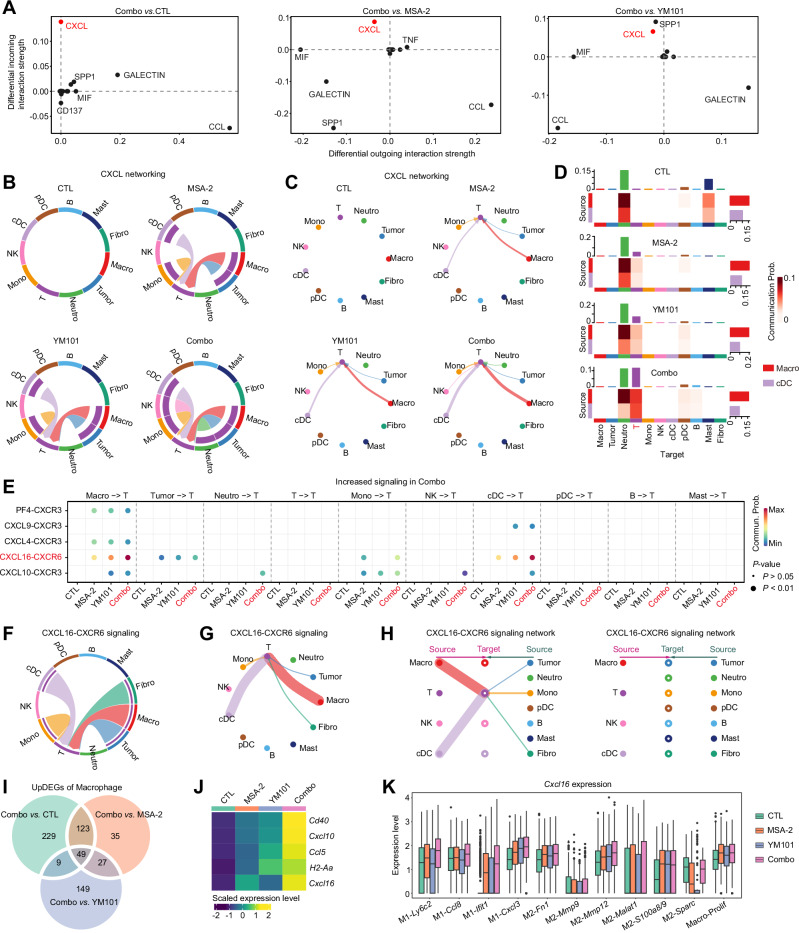
Fig. 3. Combination therapy (MSA-2?+?YM101) enhances CXCL16–CXCR6 signaling in the tumor microenvironment.
For scRNA-seq analyses, n?=?3 independent pooled samples per group (each sample pooled from tumors of two biologically independent mice; 6 mice per group in total). A Scatter plots comparing the outgoing (x-axis) and incoming (y-axis) interaction strengths of T cells in combo vs. CTL, combo vs. MSA-2, and combo vs. YM101. The CXCL signaling pathway is strengthened in the combo group. B, C Chord diagrams and circular plots illustrating CXCL signaling networks among various cell types in CTL-, MSA-2-, YM101-, and combo-treated tumors. Thicker chords and circles indicate stronger signaling contributions. D Heatmaps showing the communication probability of CXCL signals originating from macrophages and cDCs under each treatment. E Bubble plots identifying potential ligand-receptor pairs contributing to the enhanced CXCL signaling in Combo-treated tumors. Dot color represents communication probabilities, and dot size reflects statistical significance (dots are absent when no communication is inferred). F, G Chord diagrams and circular plots specifically highlighting the CXCL16–CXCR6 axis. H Network analysis mapping the source and target cells involved in CXCL16–CXCR6 signaling. I Venn diagram displaying the number of significantly upregulated genes (UpDEGs) in macrophages from Combo-treated tumors compared to CTL, MSA-2, and YM101 treatments. J Heatmap showing representative immune-related genes with increased expression in macrophages under Combo therapy. K Box plots showing Cxcl16 expression across indicated macrophage subsets in EMT-6 tumors from scRNA-seq data under CTL, MSA-2, YM101, or combination treatment. Data are shown for all macrophages from three pooled samples per group (n?=?3). Single cells are shown for visualization only and are not considered independent biological replicates. Box plots show the median (center line), 25th–75th percentiles (box), and whiskers extending to the most extreme values within 1.5?×?IQR; outliers are shown as individual points.
3. 优化细胞与组织样本制备(原文Figure 4)
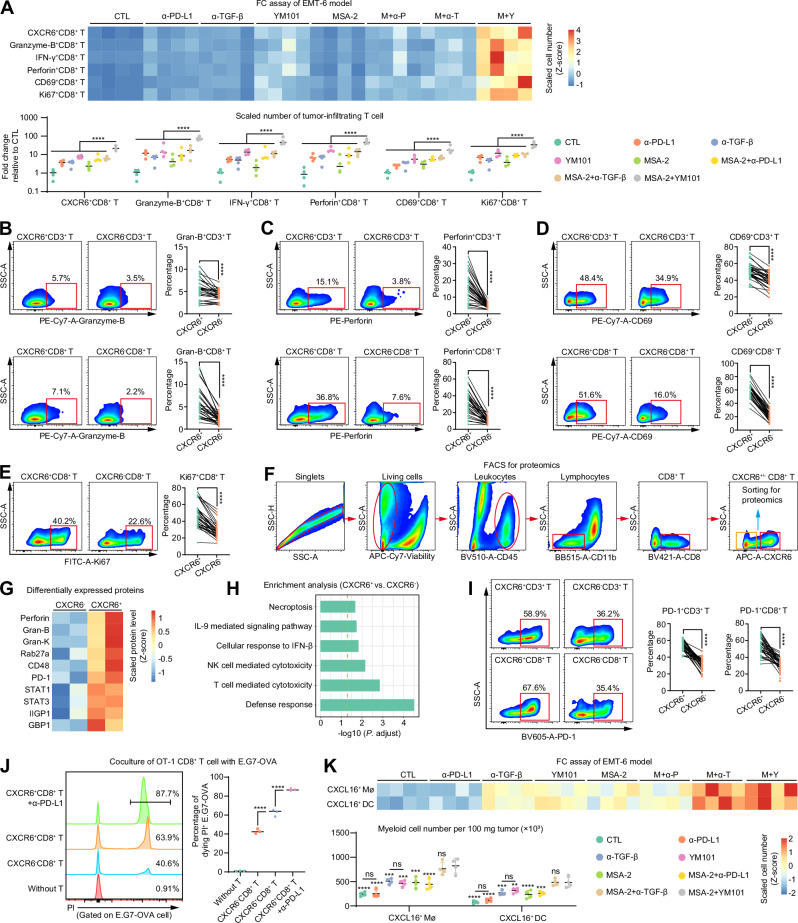
Fig. 4. Triple-targeting therapy increases tumor-infiltrating CXCR6+CD8+ T cells and CXCL16+ myeloid cells in the EMT-6 model.
A Flow cytometry (FC) analysis of the relative abundance and fold changes of tumor-infiltrating CD8? T cell subsets across different treatment conditions. Tumors were obtained from an independent cohort in which treatment was initiated when tumors reached 200–250?mm3, and tumors were collected 24?h after completion of the dosing schedule for subsequent flow cytometry analyses (n?=?4 per group). B–E Percentage plots showing increased expression of Granzyme-B, Perforin, CD69, and Ki67 in CXCR6? T cells compared to CXCR6? T cells (n?=?32 paired samples). F Gating strategy for isolating CXCR6?CD8? T cells from tumor-infiltrating lymphocytes for downstream proteomic analyses. G Heatmap of differentially expressed proteins comparing CXCR6? and CXCR6?CD8? T cells (n?=?2 per group). H Enrichment analysis of differentially expressed proteins in CXCR6? versus CXCR6?CD8? T cells. I Percentage plots demonstrating higher PD-1 expression in CXCR6?CD8? T cells relative to CXCR6?CD8? T cells (n?=?32 paired samples). J Co-culture experiment using CXCR6? or CXCR6?CD8? T cells (from OT-1 mice) with EG7-OVA cells, showing enhanced tumor cell death induced by CXCR6?CD8? T cells compared to CXCR6? T cells. Anti-PD-L1 treatment further increases cytotoxic activity (n?=?3 biological replicates; results are representative of three independent experiments). K Flow cytometry analysis of myeloid cell populations in the EMT-6 model, showing the scaled number of CXCL16+ macrophages (CXCL16+ M?) and dendritic cells (CXCL16+ DC) following treatment with the specified therapies (n?=?4 per group). Statistical comparisons were made between the M?+?Y group and all other treatment groups unless otherwise specified. B–E, I Were analyzed using two-tailed paired t-tests. A, J, K Were analyzed using one-way ANOVA followed by Holm–?ídák’s multiple comparisons test. Statistical significance is indicated as *P?<?0.05; **P?<?0.01; ***P?<?0.001; ****P?<?0.0001. Source data and exact P values are provided in the Source data file.
4. 科学结论
DNase I 介导的 DNA 水解是分子实验质控、RNA 纯化、染色质分析的必需步骤;高活性、低污染的 DNase I 试剂是获得可靠数据的核心前提。
三、Absin abs47047435:文献级核心试剂,硬核支撑高分研究
| 产品信息 |
产品名称:脱氧核糖核酸酶 Ⅰ(牛胰) 货号:abs47047435 纯度:高活性,无 RNase 残留,无蛋白酶污染 |
在本文中的关键作用(原文多图核心试剂)
核心优势(高分文献首选理由)
四、Absin 助力生命科学研究:一站式工具酶解决方案
爱必信(Absin)聚焦分子生物学核心需求,提供覆盖工具酶、核酸检测、蛋白研究的全链条试剂:
结语
本项权威研究再次印证:高品质试剂是高分文章的基础保障。Absin abs47047435 凭借高活性、高纯度、低污染的优势,成为核酸代谢、分子互作、样本制备等关键实验的 “标配试剂”。未来,Absin 将持续以文献级品质试剂,赋能全球科研工作者,助力更多高水平研究成果产出!

- 手机:13761418683