




- 手机:13761418683
联系人:爱必信
网址:http://www.absin.cn/
地 址:上海市浦东新区新浩路58号18号楼

高分辨解析神经发育,深挖皮层神经元迁移调控机制
2026-07-14
国际权威期刊Nat Commun.发表高分研究,系统揭示STEF/Tiam1?Rac1?JNK信号轴在大脑皮层神经元辐射状迁移中的关键调控机制,为神经发育障碍、脑结构异常相关疾病提供全新理论基础与干预靶点。研究中爱必信 abs9493以高特异性与稳定性,成为关键分子检测与信号通路验证的核心试剂,为高分结论保驾护航。
文献标题:Palmitic acid-triggered B7H3 palmitoylation promotes immune escape
发表期刊:Nat Commun. (IF=15.7)
DOI:https://doi.org/10.1038/s41467-026-68525-x
使用 Absin 产品:基质胶(高浓度,无酚红)(货号:abs9493)

一、研究核心思路
本研究以哺乳动物大脑皮层神经元有序迁移为核心,采用子宫电转染?在体功能?分子通路的严谨验证路径:
1. 功能锁定:明确 Rac1 及其上游激活因子STEF/Tiam1、下游JNK对皮层神经元辐射状迁移的必需性;
2. 表型区分:对比抑制 Rac1 与 JNK 后,神经元迁移障碍与突起形态的差异表型;
3. 机制深挖:证实 JNK 通过调控微管动力学、影响微管相关蛋白 MAP1B 磷酸化,维持迁移神经元突起稳定;
4. 理论构建:完善神经元迁移的胞内信号调控网络,为神经发育异常机制提供关键线索。
二、核心研究成果(标注原文对应图片)
1. STEF/Tiam1?Rac1?JNK 轴决定皮层神经元迁移
抑制该通路关键分子,显著阻断神经元辐射状迁移,不影响正常分化(原文Figure 1、Figure 2)。
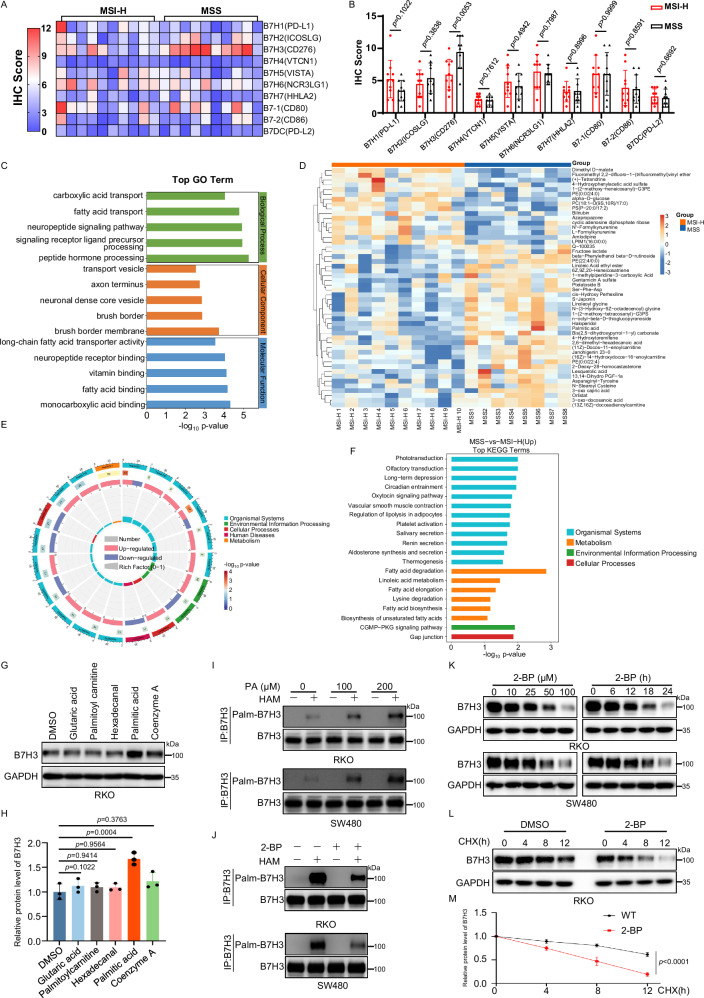
Fig. 1. PA-triggered B7H3 palmitoylation enhances B7H3 protein stability.
A Heatmap of B7 family immunohistochemical (IHC) staining score in MSI-H and MSS tumors. B Statistical results of IHC staining scores of B7 family in MSI-H and MSS tumors. (n?=?10). C RNA-seq of MSS and MSI-H tumor samples followed by Gene Ontology (GO) enrichment analysis of differentially expressed genes. D Heatmap of the top 50 representative metabolites in MSS and MSI-H tumor samples. E Kyoto encyclopedia of genes and genomes (KEGG) circos plots illustrating differential metabolites identified through untargeted metabolomics in MSS and MSI-H tumor samples. F KEGG-enriched pathway of metabolites with increased levels in MSS tumors compared to MSI-H. Immunoblot (IB) analysis of B7H3 in RKO cells treated with DMSO, glutaric acid (1?mM), palmitoylcarnitine (5?μM), hexadecanal (10?μM), palmitic acid (100?μM), or coenzyme A (3?mM) for 24?h (G) and quantification (H) (n?=?3). I Acyl-biotin exchange (ABE) assay of B7H3 palmitoylation in RKO or SW480 cells after PA treatment. PA palmitic acid. HAM hydroxylamine. The samples derive from the same experiment, but different gels for B7H3, and another for Palm-B7H3 were processed in parallel. J ABE assay of B7H3 palmitoylation in RKO or SW480 cells after 2-bromopalmitate (2-BP, 50?μM) treatment. The samples derive from the same experiment, but different gels for B7H3, and another for Palm-B7H3 were processed in parallel. K IB analysis of B7H3 after 2-BP treatment at indicated doses/times. IB analysis of B7H3 stability after CHX (100?μg/ml) treatment with 2-BP (50?μM) (L) and quantification (M) (n?=?3). Data indicate the mean?±?SD, by unpaired 2-tailed Student’s t test (B), One-way ANOVA with Dunnett’s multiple comparisons test (H), and two-way ANOVA with Tukey’s test (M). n?=?3 independent experiments (G, I–L). Source data are provided as a Source Data file.
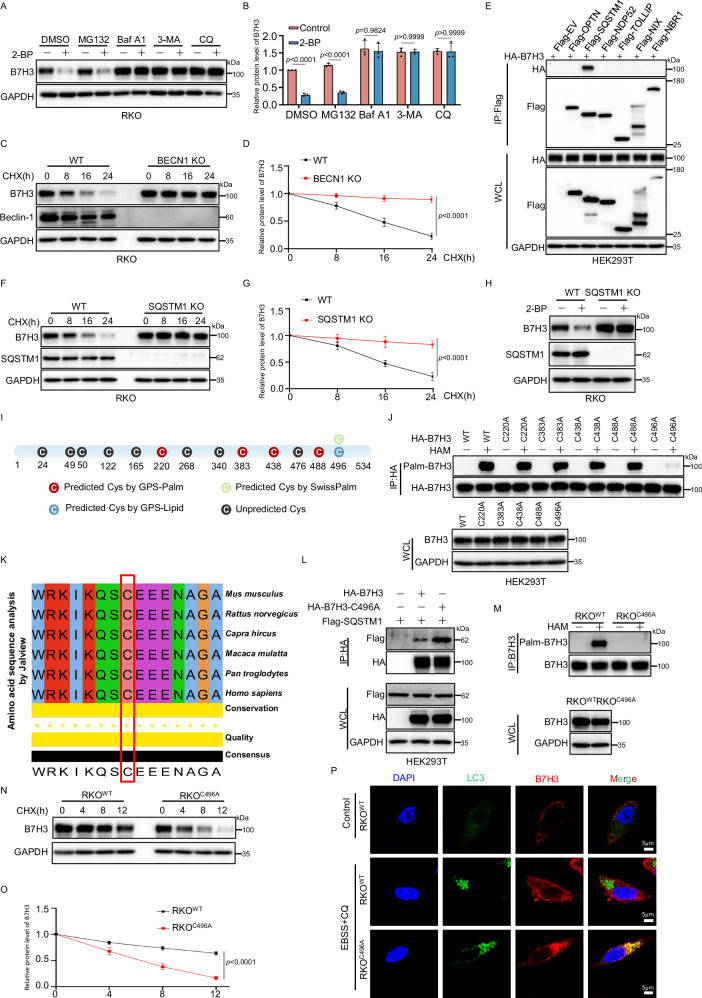
Fig. 2. B7H3 C496 palmitoylation suppresses SQSTM1/p62-mediated autophagic degradation.
IB analysis of B7H3 after treatment with MG132 (10?μM), bafilomycin A1 (Baf A1, 0.2?μM), 3-methyladenine (3-MA, 5?mM), or chloroquine (CQ, 50?μM) for 8?h (A) and quantification (B). (n?=?3). IB analysis of B7H3 stability after CHX (100?μg/ml) treatment in WT and BECN1 KO RKO cells (C) and quantification (D). (n?=?3). E Co-immunoprecipitation (co-IP) of HA-B7H3 with indicated Flag-tagged cargo receptors in HEK293T cells. The samples derive from the same experiment, but different gels for Flag, and another for HA and GAPDH, were processed in parallel. IB analysis of B7H3 stability after CHX (100?μg/ml) treatment in WT and SQSTM1 KO RKO cells (F) and quantification (G). (n?=?3). H IB analysis of B7H3 in WT and SQSTM1 KO RKO cells treated with DMSO or 2-BP (100?μM). I Schematic of the predicted B7H3 palmitoylation site. J ABE assay of palmitoylation of B7H3 WT and indicated site mutants. The samples derive from the same experiment, but different gels for B7H3, and another for Palm-B7H3 were processed in parallel. K Multiple sequence alignment of B7H3 across species by Jalview. L Co-IP of Flag-SQSTM1 with HA-B7H3 WT or C496A in HEK293T cells. M ABE assay of palmitoylation in RKO stable cell lines expressing B7H3 WT or C496A. The samples derive from the same experiment, but different gels for B7H3, and another for Palm-B7H3 were processed in parallel. IB analysis of B7H3 stability after CHX (100?μg/ml) treatment in RKOWT and RKOC496A cells (N) and quantification (O). (n?=?3). P Representative images of confocal microscopy after treatment of RKOWT or RKOC496A with EBSS and CQ (50?μM) for 8?h. Scale bars, 5?μm. Data indicate the mean?±?SD, by unpaired 2-tailed Student’s t test (B) and two-way ANOVA with Tukey’s test (D, G, O). n?=?3 independent experiments (A, C, E, F, H, J, L–N, P). Source data are provided as a Source Data file.
2. Rac1 与 JNK 呈现差异化形态表型
? 抑制 Rac1:神经元丢失先导突起,迁移停滞;
? 抑制 JNK:突起形态异常、微管稳定性上升,但不丢失先导突起(原文Figure 3、Figure 4)。
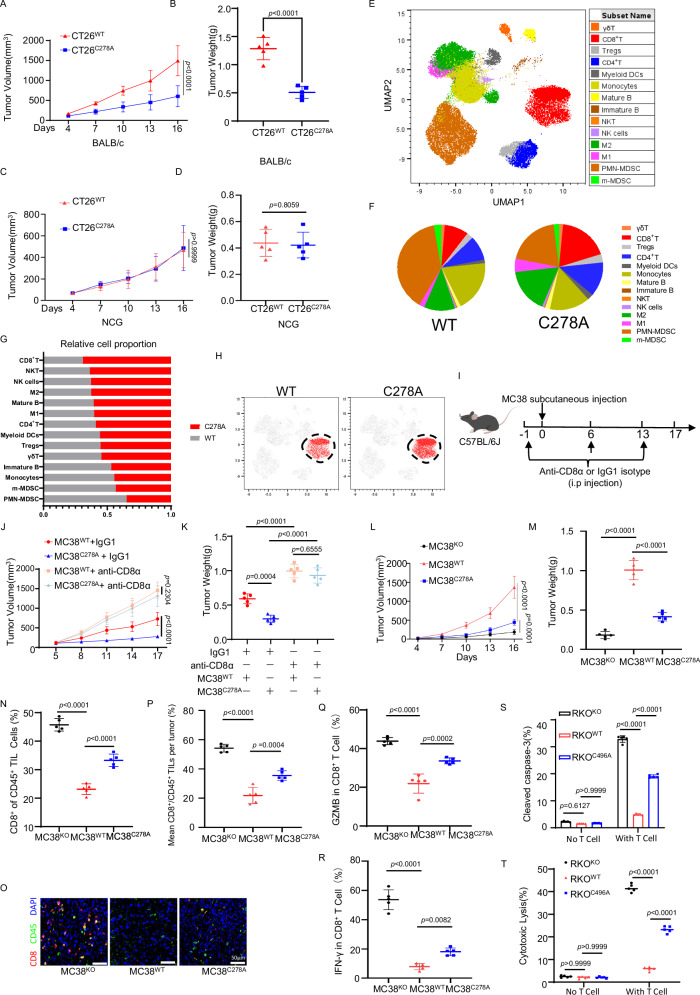
Fig. 3. B7H3 palmitoylation inhibits the antitumor activity of CD8+ T cells.
Tumor growth (A) and tumor weight (B) of CT26WT versus CT26C278A tumors in BALB/c mice (n?=?5). Tumor growth (C) and tumor weight (D) of CT26WT versus CT26C278A tumors in NCG mice (n?=?5). Spectral flow cytometry analysis of CD45? immune infiltrates in CT26WT and CT26C278A tumors from BALB/c mice (n?=?5): UMAP clustering (E), immune composition (F), proportions of immune subpopulations (G), and CD8? T-cell density map (H). I–K C57BL/6J mice were intraperitoneally injected with 200?μg of anti-CD8α depleting antibody or isotype control per mouse one day before subcutaneous inoculation of MC38WT or MC38C278A cells, and then once weekly thereafter for a total of three doses (n?=?5). Schematic (I), tumor growth curves (J), and tumor weights (K). (L to R). MC38KO, MC38WT, and MC38C278A cells were injected subcutaneously into C57BL/6?J mice (n?=?5). L Tumor growth curves. M Tumor weights. N Relative levels of tumor-infiltrating CD8+ T by flow cytometry. O Representative images of immunofluorescence of CD8+ T cells and CD45+ cells in subcutaneous graft tumors. Scale bars, 50?μm. P Quantification of CD8? cells among CD45? tumor-infiltrating leukocytes (TILs) from (O) (n?=?5). For each tumor, three fields were quantified and averaged to obtain one value per tumor. Q Flow cytometry analysis of Granzyme B (GZMB) expression in tumor-infiltrating CD8+ T cells. R Flow cytometry analysis of Interferon-γ (IFN-γ) expression in tumor-infiltrating CD8+ T cells. S, T RKOKO, RKOWT, and RKOC496A cells were co-cultured with activated human T lymphocytes (n?=?5). S Statistical analysis shows the percentage of caspase-3 in tumor cells by flow cytometry. T Cell-free supernatants were collected, and LDH release was measured to calculate percent cytotoxicity. Data indicate the mean?±?SD, by unpaired 2-tailed Student’s t test (B, D), one-way ANOVA with Tukey’s test (K, M, N, P, Q, R), and two-way ANOVA with Tukey’s test (A, C, J, L, S, T). Source data are provided as a Source Data file.
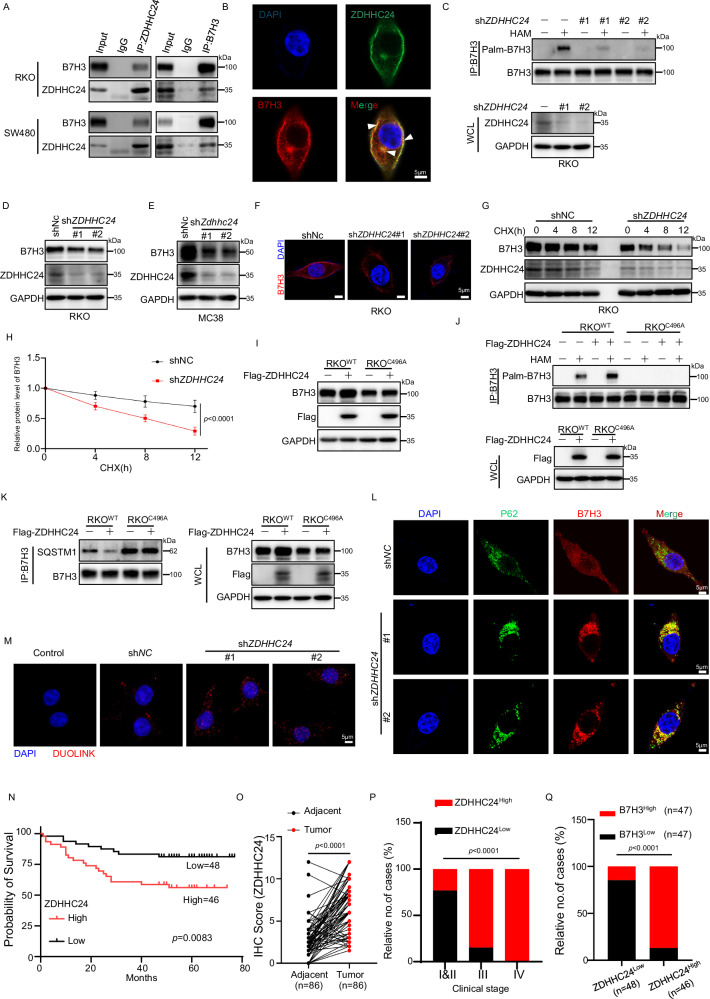
Fig. 4. ZDHHC24-mediated B7H3 palmitoylation promotes protein stability and is linked to poor colorectal cancer outcomes.
A Co-IP showing endogenous B7H3–ZDHHC24 interaction. B Confocal images showing co-localization of B7H3 and ZDHHC24 in RKO cells. Scale bars, 5?μm. C ABE assay of B7H3 palmitoylation in ZDHHC24-knockdown RKO cells. IB of B7H3 in RKO (D) and MC38 (E) cells with control or ZDHHC24/Zdhhc24 knockdown. F Confocal images of B7H3 staining in RKO shNC or shZDHHC24 cells. Scale bars, 5?μm. IB of B7H3 after CHX (100?μg/mL) for the indicated times (G) and quantification (H) (n?=?3). IB of B7H3 protein levels (I) and ABE assay of B7H3 palmitoylation (J) after ZDHHC24 overexpression in RKOB7H3 WT and RKOB7H3 C496A cells. K Co-IP of B7H3 with SQSTM1 in RKOB7H3 WT and RKOB7H3 C496A cells with or without Flag-ZDHHC24 expression. L Confocal images of RKO shNC or shZDHHC24 cells after EBSS and CQ (50?μM) treatment for 8?h. Scale bars, 5?μm. M Duolink PLA showing B7H3–p62 interactions. Scale bars, 5?μm. N Kaplan–Meier overall survival stratified by ZDHHC24 expression (n?=?94; log-rank test). O ZDHHC24 IHC staining in paired adjacent and primary tissues (n?=?86 pairs). P ZDHHC24 IHC staining scores across tumor stages (n?=?94). Q Association between ZDHHC24 and B7H3 IHC staining (n?=?94). The samples (D, E, G, I, K) derive from the same experiment, but different gels for ZDHHC24/Flag, and another for B7H3 and GAPDH were processed in parallel. The samples (C, J) derive from the same experiment, but different gels for ZDHHC24, another for GAPDH, another for B7H3, and another for Palm-B7H3 were processed in parallel. Data indicate the mean?±?SD, by two-way ANOVA with Tukey’s test (H), paired 2-tailed Student’s t test (O), chi-square test (P), and two-sided chi-square test (Q). n?=?3 independent experiments (A–G, I–M). Source data are provided as a Source Data file.
3. JNK 通过调控微管动力学驱动迁移
活化 JNK 沿突起微管分布;JNK 抑制剂降低 MAP1B 磷酸化、增加稳定微管,导致迁移受阻(原文Figure 5、Figure 6)。
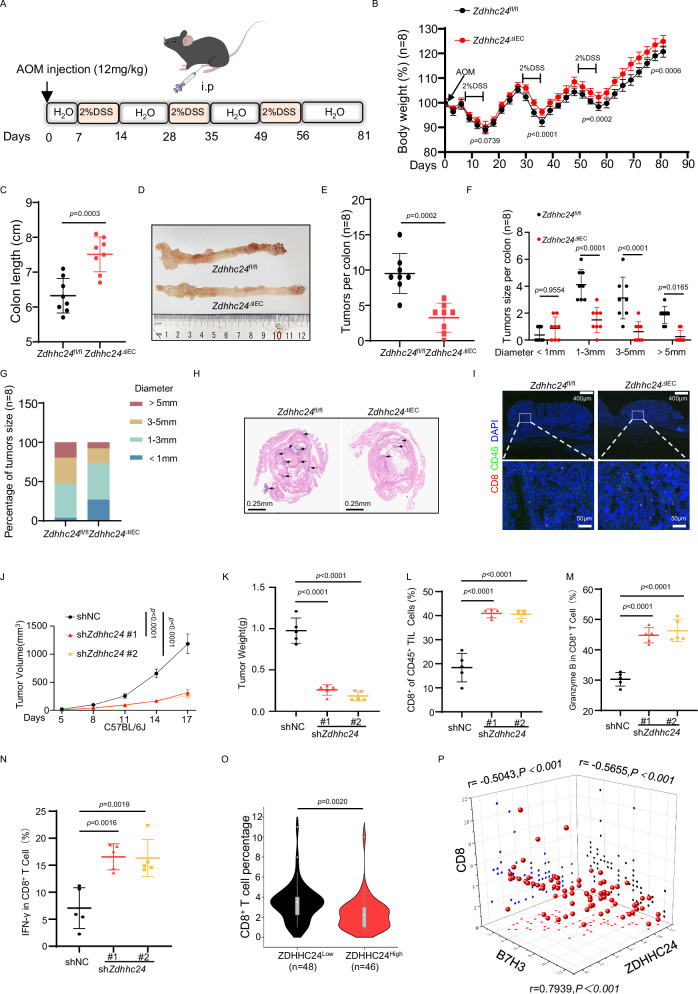
Fig. 5. ZDHHC24 promotes tumor growth by inhibiting the antitumor activity of CD8+ T cells.
A Schematic of azoxymethane (AOM)/ dextran sulfate sodium (DSS)-induced colitis-associated colorectal cancer (CAC) model. Body weight change (B) and colon length (C) of Zdhhc24fl/fl and Zdhhc24ΔIEC mice during AOM/DSS treatments (n?=?8). D Representative images of Zdhhc24fl/fl and Zdhhc24ΔIEC mice after longitudinal sectioning of the colon. Tumor number (E) and tumor size distributions (F, G) in Zdhhc24fl/fl and Zdhhc24ΔIEC mice (n?=?8). Representative H&E staining (H) and immunofluorescence staining (I) of colon tissues/tumors in Zdhhc24fl/fl and Zdhhc24ΔIEC mice. Scale bars, 0.25?mm (H), 400?μm (top in I), and 50?μm (bottom in I). J–N MC38 shNC, MC38 shZdhhc24 (#1 and #2) cells were injected subcutaneously into C57BL/6J mice (n?=?5). J Tumor growth curves. K Tumor weights. L Relative levels of tumor-infiltrating CD8+ T by flow cytometry. M Flow cytometry analysis of GZMB expression in tumor-infiltrating CD8+ T cells. N Flow cytometry analysis of IFN-γ expression in tumor-infiltrating CD8+ T cells. O Quantification of CD8+T cell percentage in CRC tissue microarrays stratified by ZDHHC24 IHC expression (ZDHHC24Low, n?=?48; ZDHHC24High, n?=?46). Violin plots show the data distribution. Box plots show the median (center marker), the 25th and 75th percentiles (box limits) and whiskers extending to 1.5?×?IQR; points beyond the whiskers represent outliers. P Correlation of ZDHHC24, B7H3 and CD8? T cell IHC staining scores in CRC tissue microarrays (n?=?94) assessed by Pearson’s correlation (two-tailed); r and exact P values are shown (no adjustment for multiple comparisons was applied). Data indicate the mean?±?SD, by unpaired 2-tailed Student’s t test (B, C, E, F, O), one-way ANOVA with Tukey’s test (K, L, M, N). Two-way ANOVA with Tukey’s test (J). n?=?3 independent experiments (H, I). Source data are provided as a Source Data file.
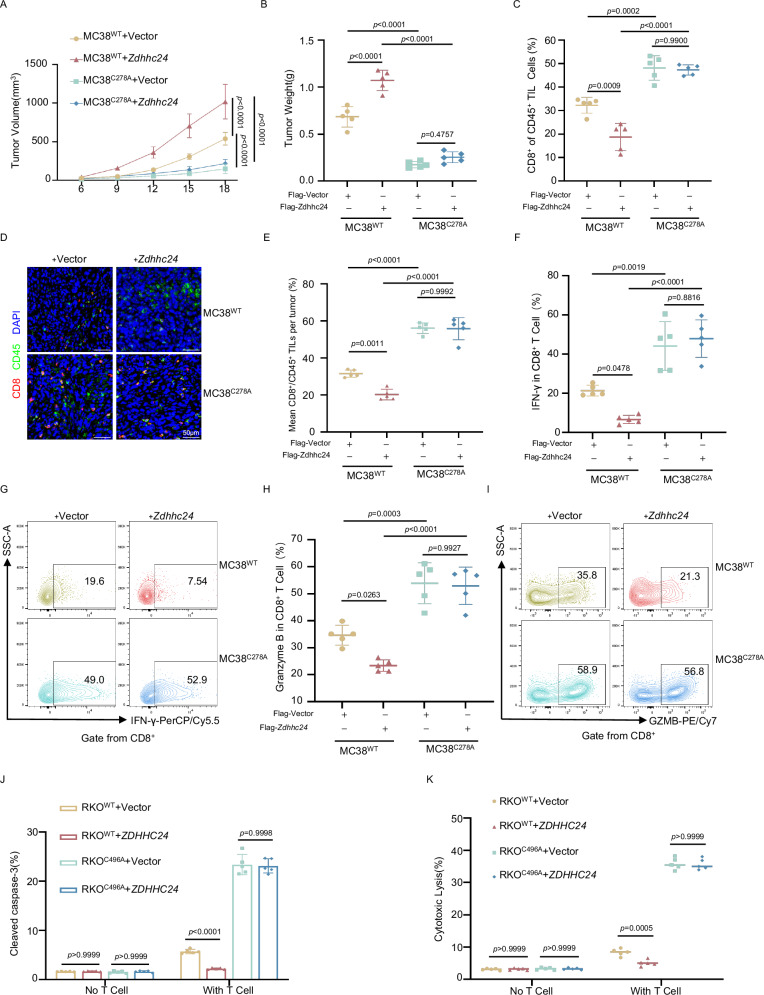
Fig. 6. ZDHHC24 inhibition of antitumor effects on CD8+ T cells requires B7H3 palmitoylation.
A–I MC38WT+Vector, MC38WT+Zdhhc24, MC38C278A+Vector, and MC38C278A+ Zdhhc24 cells were injected subcutaneously into C57BL/6J mice (n?=?5). A The volume of the subcutaneous graft tumors was measured on the indicated days, and growth curves were drawn. B Quantification of measured weights of subcutaneous graft tumors. C Relative levels of tumor-infiltrating CD8+ T cells by flow cytometry. D Representative immunofluorescence images of tumor tissues. Scale bars, 50?μm. E Quantification of CD8?/CD45? TILs from (D) (n?=?5). For each tumor, three fields were quantified and averaged to obtain one value per tumor. F Flow cytometry analysis of IFN-γ expression in tumor-infiltrating CD8+ T cells. G Representative images of tumor-infiltrating IFN-γ+CD8+ T cells analyzed by flow cytometry. H Flow cytometry analysis of GZMB expression in tumor-infiltrating CD8+ T cells. I Representative images of tumor-infiltrating GZMB+ CD8+ T cells analyzed by flow cytometry. J, K RKOWT +?Vector, RKOWT +?ZDHHC24, RKOC496A +?Vector, and RKOC496A +?ZDHHC24 cells were co-cultured with activated human T lymphocytes (n?=?5). J Statistical analysis shows the percentage of caspase-3+ in tumor cells by flow cytometry. K Cell-free supernatants were collected, and LDH release was measured to calculate percent cytotoxicity. Data indicate the mean?±?SD, by one-way ANOVA with Tukey’s test (B, C, E, F, H) and two-way ANOVA with Tukey’s test (A, J, K). Source data are provided as a Source Data file.
4. 科学结论
STEF/Tiam1?Rac1?JNK是皮层神经元辐射状迁移的核心信号轴,JNK 通过微调微管骨架动态保障神经元正常迁移。
三、abs9493 在研究中的关键作用(原文多图核心试剂)
本研究使用爱必信 abs9493完成JNK 磷酸化检测、MAP1B 表达 / 磷酸化定量、Western Blot等关键实验,支撑Figure 4、Figure 5、Figure 6核心结果,是通路机制验证的 “金标准试剂”。
核心价值
1. 高特异性,精准识别靶标
2. 信号稳定,适配在体样本
3. 批间一致性强,数据可重复
4. 兼容多检测场景
四、absin 赋能神经发育与信号通路研究
爱必信(absin)提供覆盖神经发育、细胞骨架、激酶信号的全链条试剂:
? 抗体:JNK、p?JNK、Rac1、MAP1B、STEF/Tiam1 等核心靶点;
? 工具化合物:JNK 抑制剂、Rac1 激活剂 / 抑制剂;
? 检测试剂:高灵敏度 WB 试剂盒、免疫荧光显色试剂。
结语
本项神经发育领域高分研究,再次印证高品质试剂是机制突破的关键。爱必信 abs9493 以优异性能助力 JNK?微管调控轴的精准解析,支撑从功能表型到分子机制的完整闭环。absin 将持续以可靠试剂赋能神经科学、细胞迁移、信号转导等领域科研突破,陪伴更多研究者登顶国际顶刊!

- 手机:13761418683